B. subtilis Expression Data Browser
Details about fadG Show/Hide
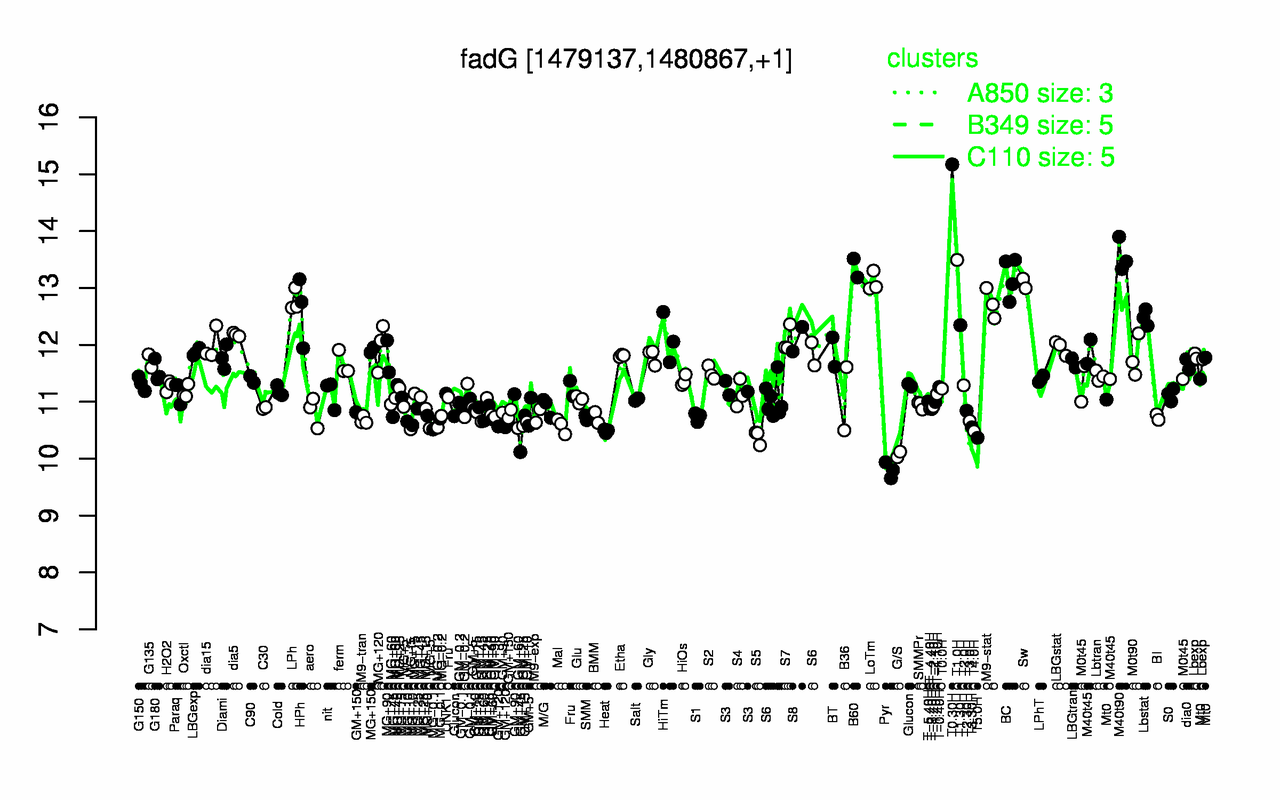
Highest Expression Conditions
T0.30H M40t90 T1.0H B60 BC LoTm Sw LPh M9-stat HPh
15.2 13.6 13.5 13.4 13.2 13.1 13.1 12.8 12.7 12.6
Lowest Expression Conditions
Pyr G/S T5.0H S5 T4.0H Heat GM+45 MG+t5 T3.30H GM+120
9.8 10.1 10.4 10.4 10.5 10.5 10.5 10.5 10.6 10.6
Most Positively Correlated Segments
ykzU S510 S509 fadH lcfB mdxF S1320 yvdJ mdxD mdxG
0.97 0.91 0.67 0.66 0.61 0.59 0.59 0.58 0.58 0.58
Most Negatively Correlated Segments
opuBC artQ artP opuBA S909 artR S888 opuBB tyrA S366
-0.52 -0.51 -0.51 -0.5 -0.5 -0.48 -0.48 -0.48 -0.47 -0.47
Expression Profile of Segment fadG Show/Hide
Annotation of Gene fadG Show/Hide
inference
ab initio prediction:AMIGene:2.0
codon_start
1
product
conserved hypothetical protein
transl_table
11
note
Evidence 4: Homologs of previously reported genes of unknown function; PubMedId: 17189250
db_xref
GI:225184956
protein_id
CAX52614.1
Genomic View of Gene/Segment fadG Show/Hide
(Legend)