| Start Page |
|
 |
| Start Page |
|
|
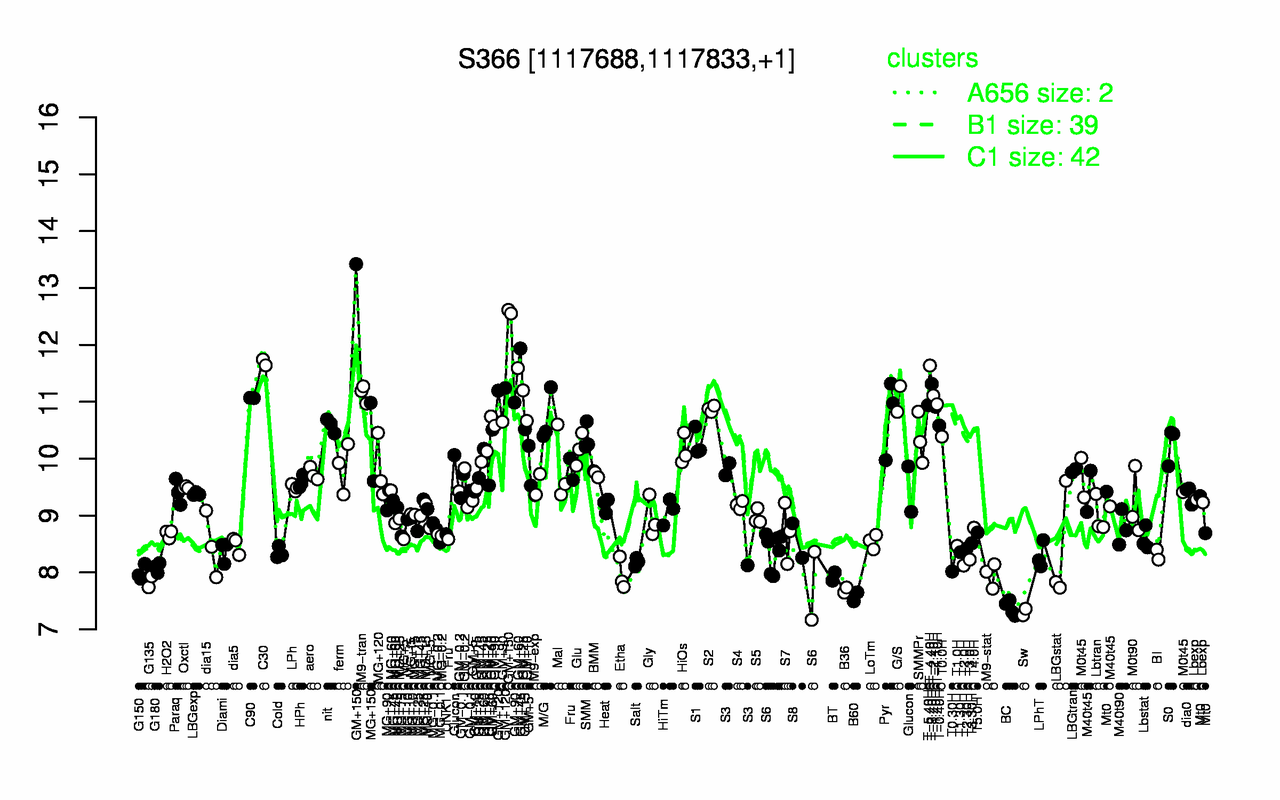
| GM+150 | C30 | T-4.40H | T-3.40H | GM+120 | M9-tran | T-2.40H | C90 | G/S | T-1.10H |
| 12.9 | 11.7 | 11.6 | 11.3 | 11.2 | 11.1 | 11.1 | 11.1 | 11 | 11 |
| Sw | BC | B60 | B36 | G135 | BT | Etha | M9-stat | G150 | T0.30H |
| 7.3 | 7.38 | 7.57 | 7.69 | 7.83 | 7.93 | 7.95 | 7.96 | 8 | 8.02 |