| Start Page |
|
 |
| Start Page |
|
|
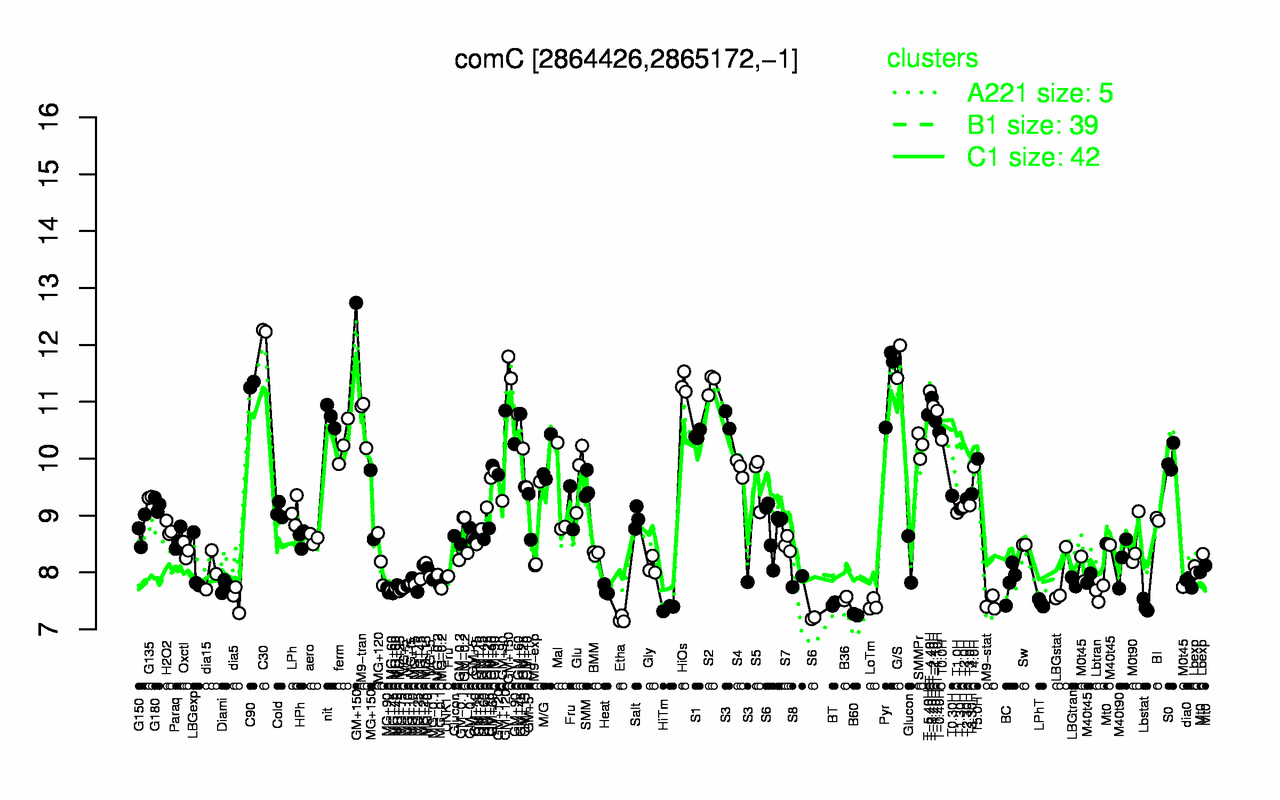
| C30 | GM+150 | G/S | Pyr | HiOs | S2 | C90 | T-4.40H | T-3.40H | T-2.40H |
| 12.2 | 12 | 11.7 | 11.4 | 11.3 | 11.3 | 11.3 | 11.2 | 11.1 | 10.9 |
| Etha | B60 | HiTm | Lbstat | LoTm | BT | M9-stat | LPhT | dia5 | B36 |
| 7.18 | 7.26 | 7.37 | 7.41 | 7.43 | 7.44 | 7.45 | 7.47 | 7.54 | 7.54 |