| Start Page |
|
 |
| Start Page |
|
|
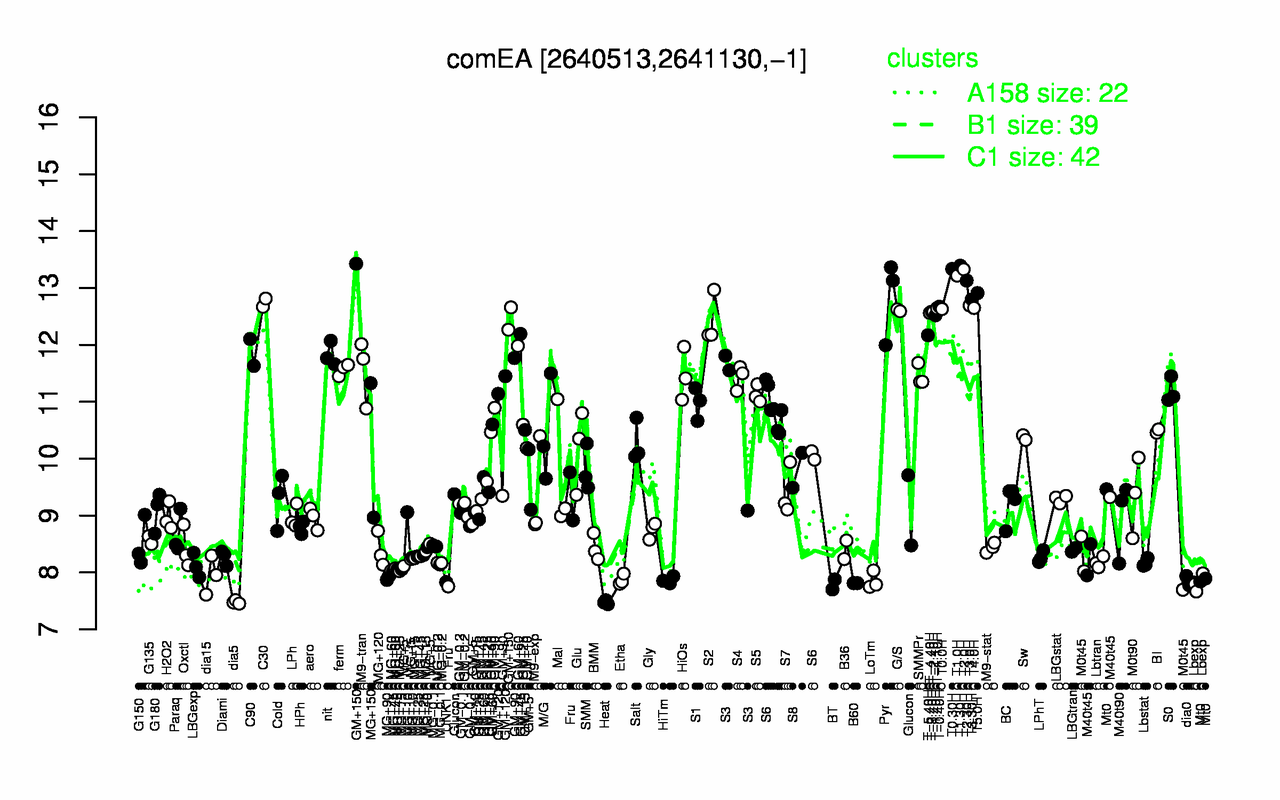
| T1.30H | T0.30H | T2.0H | T1.0H | T2.30H | T5.0H | Pyr | T3.30H | GM+150 | C30 |
| 13.4 | 13.3 | 13.3 | 13.2 | 13.1 | 12.9 | 12.8 | 12.8 | 12.8 | 12.7 |
| Heat | dia5 | BT | B60 | Lbexp | UNK1 | dia0 | LoTm | HiTm | Etha |
| 7.47 | 7.48 | 7.79 | 7.81 | 7.81 | 7.83 | 7.85 | 7.86 | 7.87 | 7.87 |