| Start Page |
|
 |
| Start Page |
|
|
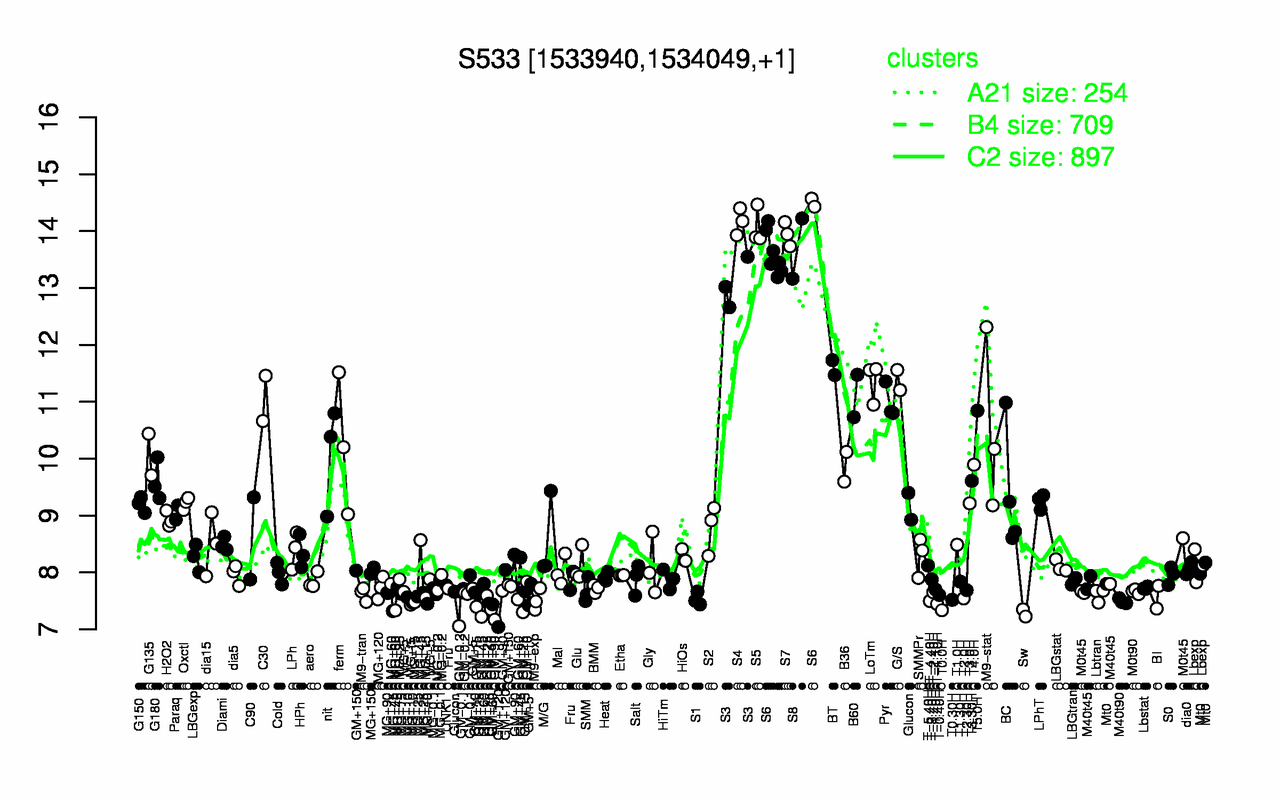
| S4 | S5 | S7 | S6 | S8 | S3 | BT | G/S | LoTm | B60 |
| 14.2 | 14.1 | 13.9 | 13.8 | 13.7 | 13.1 | 11.6 | 11.4 | 11.4 | 11.1 |
| Sw | T0.0H | MG+t5 | GM-0.2 | T-1.10H | MG+10 | M40t90 | T-4.40H | GM+15 | T0.30H |
| 7.29 | 7.34 | 7.43 | 7.44 | 7.45 | 7.49 | 7.5 | 7.5 | 7.5 | 7.52 |