| Start Page |
|
 |
| Start Page |
|
|
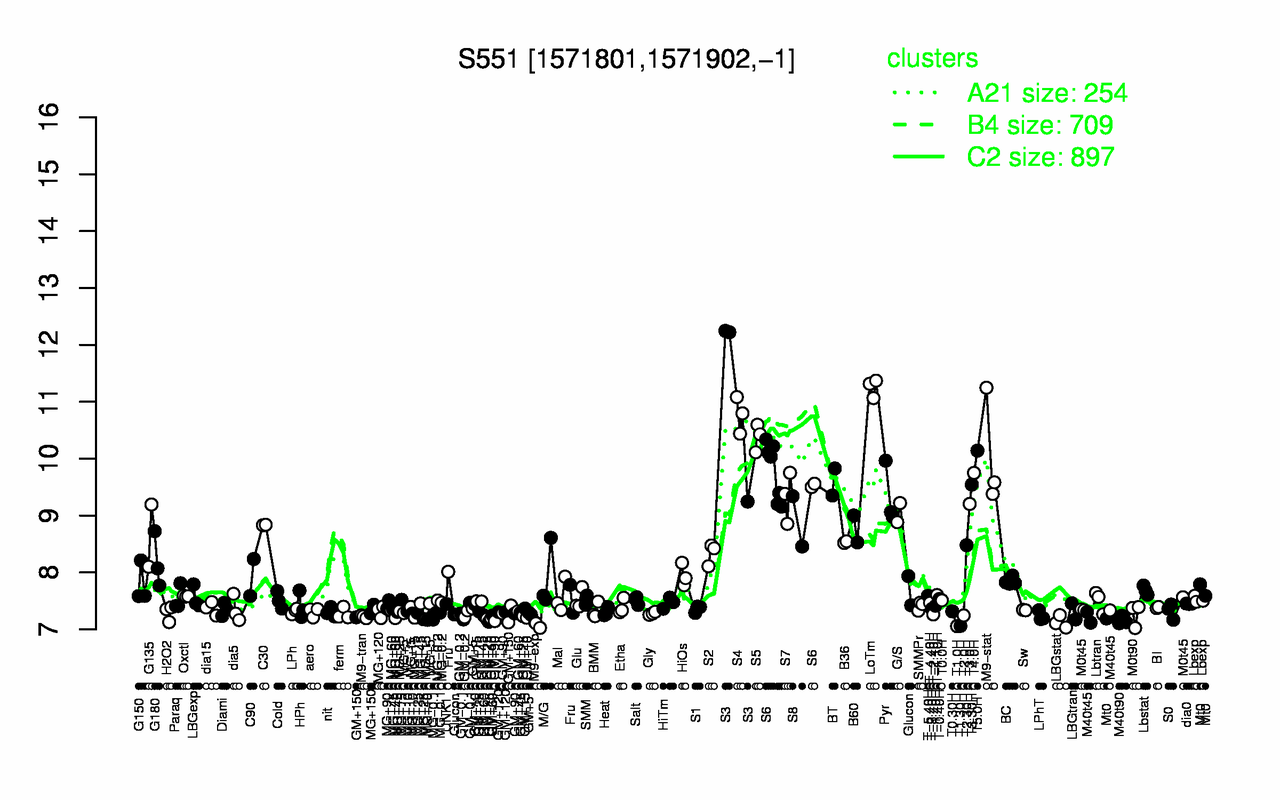
| LoTm | S3 | S4 | S5 | T5.0H | M9-stat | T4.0H | S6 | BT | T3.30H |
| 11.3 | 11.2 | 10.8 | 10.4 | 10.1 | 10.1 | 9.75 | 9.72 | 9.59 | 9.54 |
| T1.0H | T1.30H | M9-exp | LBGstat | M40t90 | M9-tran | GM+90 | LPhT | T2.0H | GM+25 |
| 7.06 | 7.06 | 7.08 | 7.13 | 7.16 | 7.22 | 7.23 | 7.24 | 7.24 | 7.25 |