| Start Page |
|
 |
| Start Page |
|
|
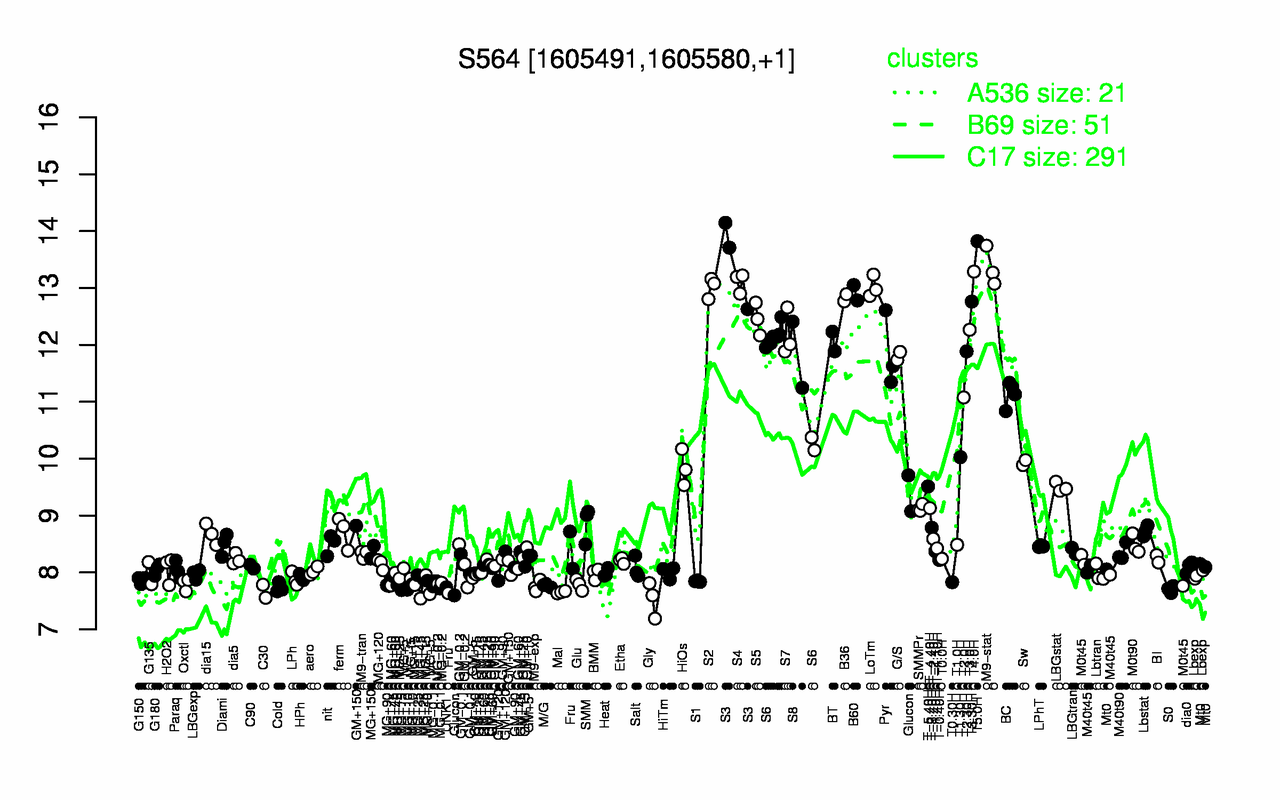
| T5.0H | S3 | M9-stat | T4.0H | S4 | LoTm | S2 | B60 | B36 | T3.30H |
| 13.8 | 13.5 | 13.4 | 13.3 | 13.1 | 13 | 13 | 12.9 | 12.8 | 12.8 |
| Gly | Mal | C30 | S0 | Cold | UNK1 | MG+45 | M9-exp | MG+90 | M/G |
| 7.53 | 7.65 | 7.67 | 7.7 | 7.73 | 7.74 | 7.75 | 7.76 | 7.77 | 7.77 |