| Start Page |
|
 |
| Start Page |
|
|
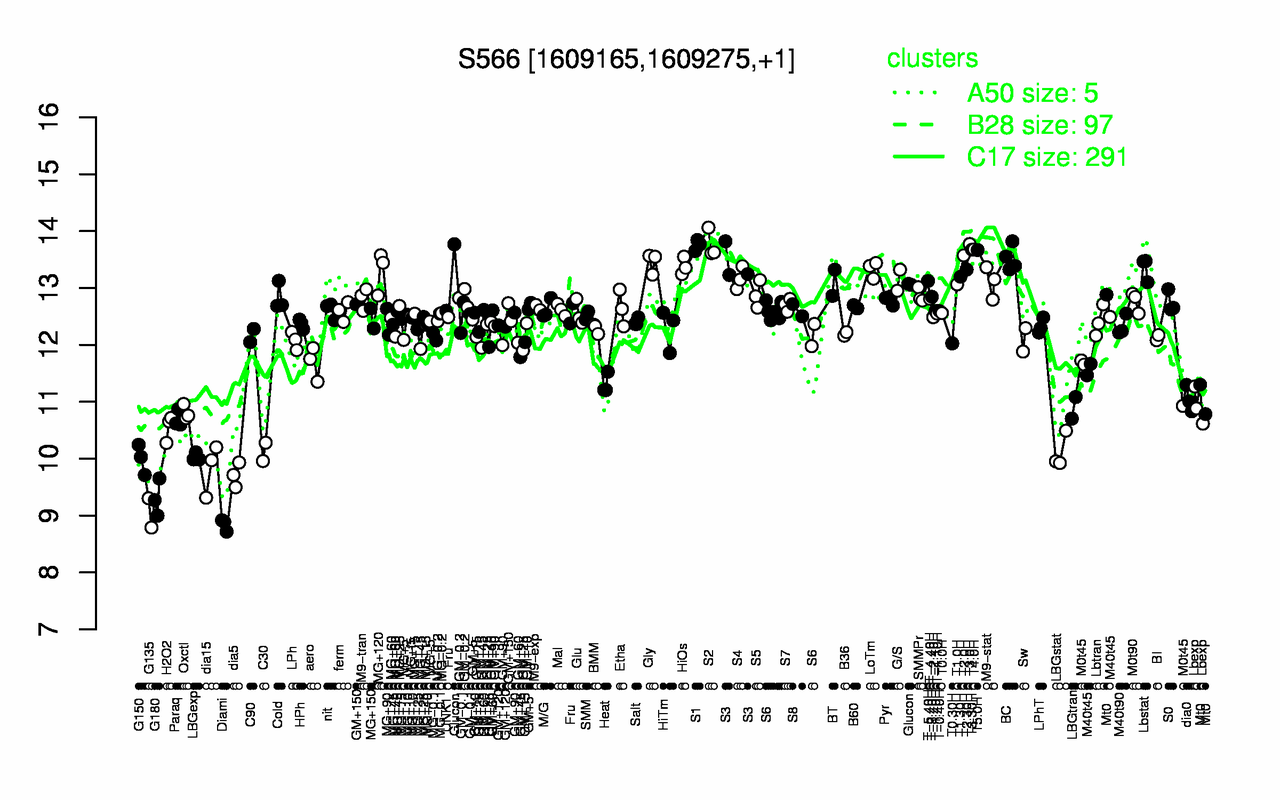
| T3.0H | S2 | S1 | T4.0H | T3.30H | T5.0H | T2.0H | BC | Gly | S3 |
| 13.8 | 13.8 | 13.8 | 13.7 | 13.7 | 13.7 | 13.6 | 13.5 | 13.5 | 13.4 |
| Diami | G135 | G180 | dia5 | dia15 | G150 | LBGexp | C30 | LBGstat | H2O2 |
| 8.84 | 9.05 | 9.31 | 9.71 | 9.83 | 9.99 | 10 | 10.1 | 10.1 | 10.5 |