| Start Page |
|
 |
| Start Page |
|
|
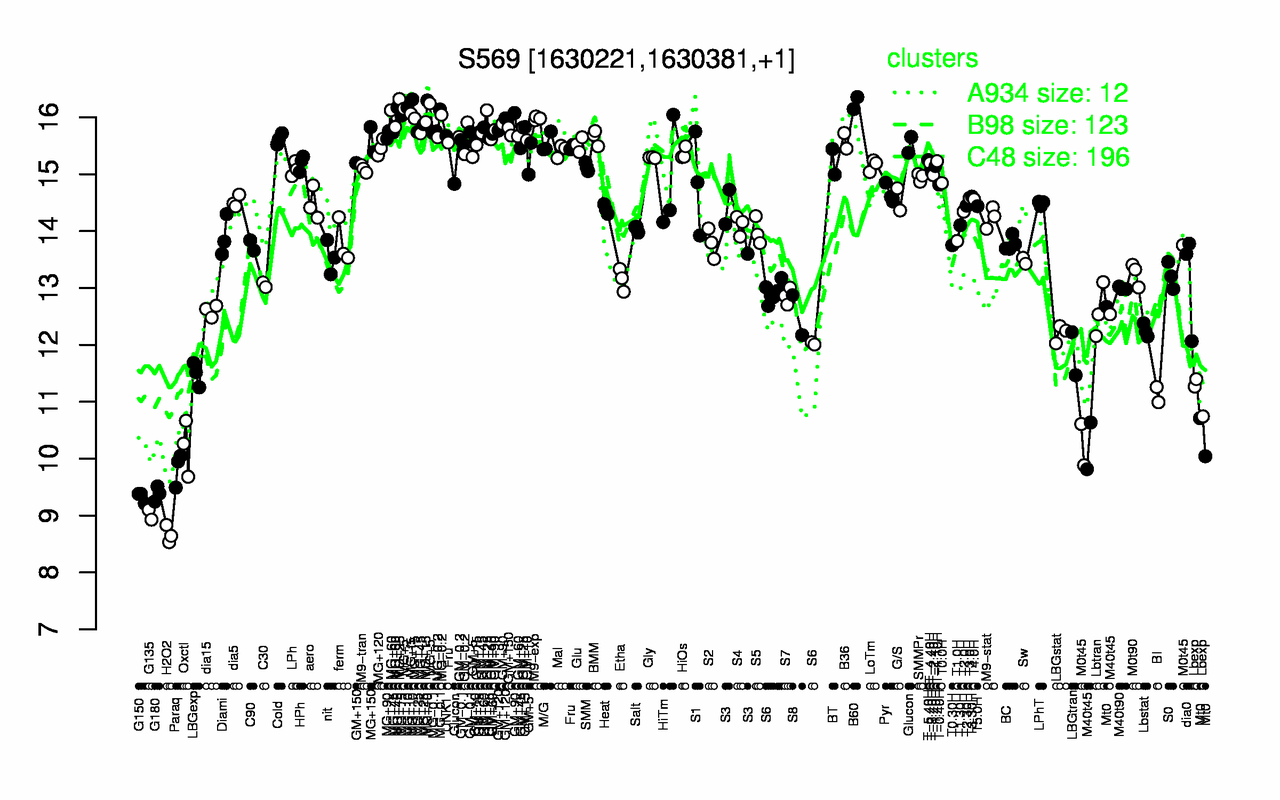
| MG+10 | B60 | MG+5 | MG+t5 | M9-exp | MG+25 | MG+60 | MG+15 | GM+90 | GM+25 |
| 16.3 | 16.3 | 16.2 | 16.1 | 16 | 16 | 16 | 16 | 15.9 | 15.9 |
| H2O2 | G135 | G150 | G180 | Paraq | Oxctl | M40t45 | BI | Lbexp | Mt0 |
| 8.67 | 9.02 | 9.32 | 9.38 | 9.83 | 10.2 | 11 | 11.1 | 11.1 | 11.1 |