| Start Page |
|
 |
| Start Page |
|
|
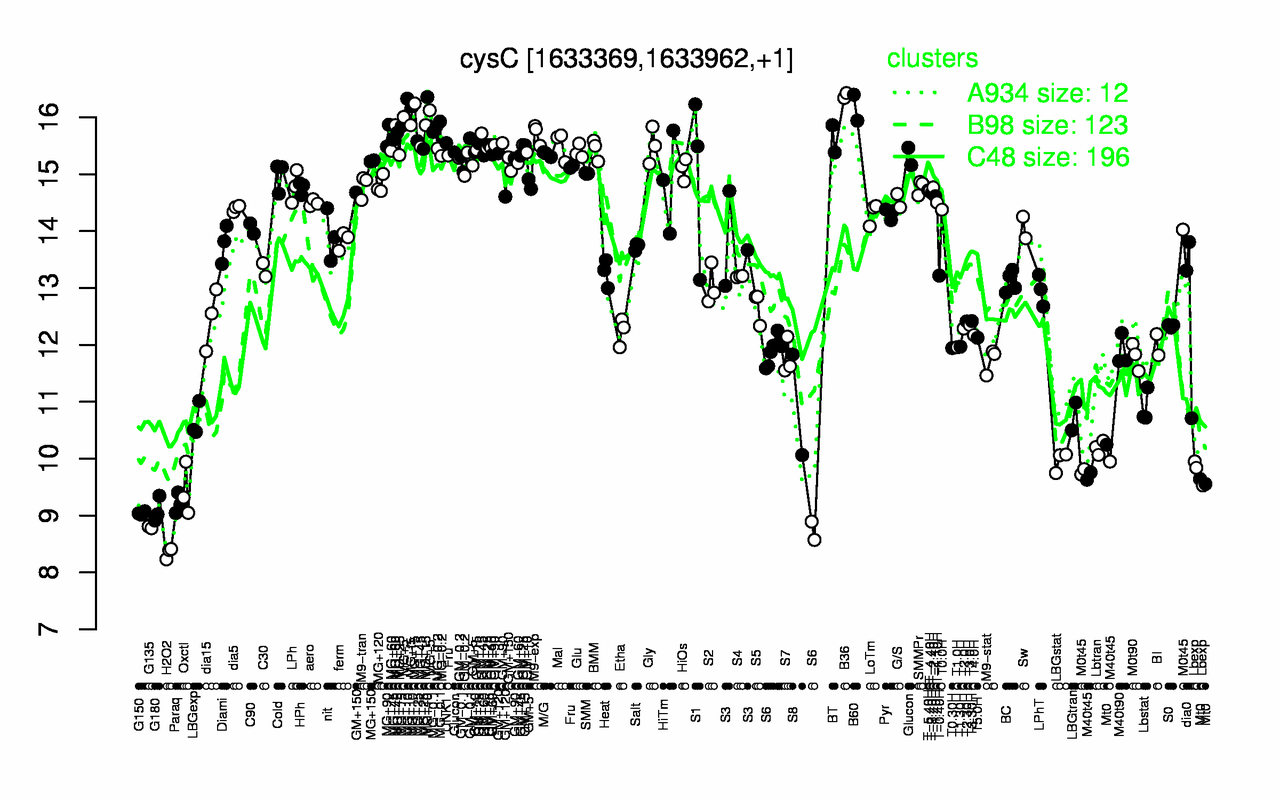
| B36 | MG+10 | B60 | MG+5 | MG+15 | MG+t5 | MG-0.1 | M9-exp | MG+90 | MG+60 |
| 16.4 | 16.3 | 16.2 | 16.1 | 16 | 15.9 | 15.8 | 15.7 | 15.7 | 15.6 |
| H2O2 | G135 | G150 | G180 | Paraq | Oxctl | Lbexp | M40t45 | Mt0 | LBGstat |
| 8.34 | 8.79 | 9.04 | 9.09 | 9.21 | 9.44 | 9.77 | 9.78 | 9.82 | 9.96 |