B. subtilis Expression Data Browser
Start Page
B. subtilis Expression Data Browser
Gene/Segment:
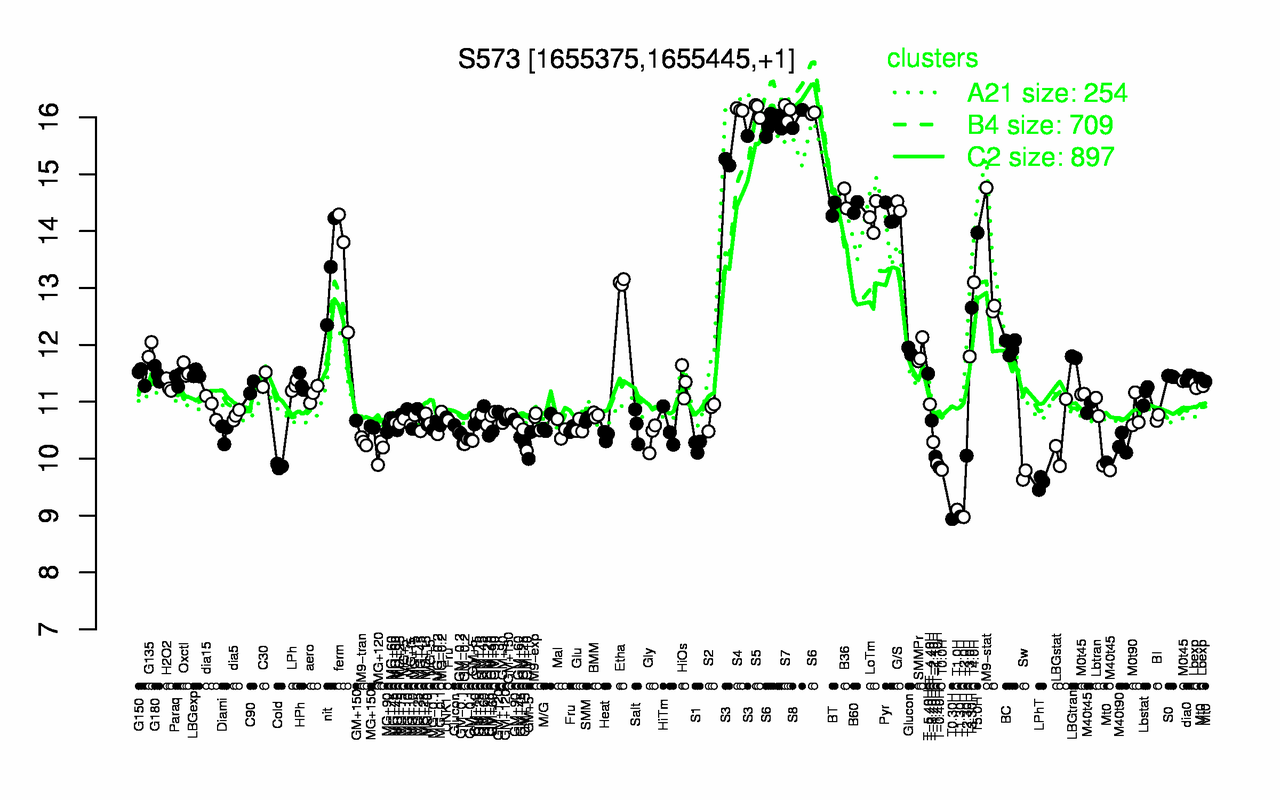
S573
Locus Tag:
new_1655375_1655445
Details about S573
Show/Hide
Highest Expression Conditions
S4
S5
S7
S8
S6
S3
B36
G/S
B60
BT
16.1
16.1
16.1
16
15.9
15.4
14.6
14.4
14.4
14.4
Lowest Expression Conditions
T0.30H
T2.0H
T1.30H
T1.0H
LPhT
Sw
T0.0H
T-0.40H
Cold
T-1.10H
8.94
8.97
8.98
9.1
9.58
9.71
9.8
9.85
9.87
9.91
Most Positively Correlated Segments
spoVM
spoVK
ymxH
S597
S264
yflJ
ytfJ
cwlJ
yutG
alrB
1
0.96
0.95
0.95
0.95
0.95
0.94
0.94
0.94
0.94
Most Negatively Correlated Segments
addA
addB
sbcD
sbcC
yugH
yceG
yeaC
yceH
S378
yuaD
-0.86
-0.85
-0.84
-0.84
-0.83
-0.83
-0.82
-0.82
-0.82
-0.82
Expression Profile of Segment S573
Show/Hide
Genomic View of Gene/Segment S573
Show/Hide
(Legend)
Browse Genome Context