| Start Page |
|
 |
| Start Page |
|
|
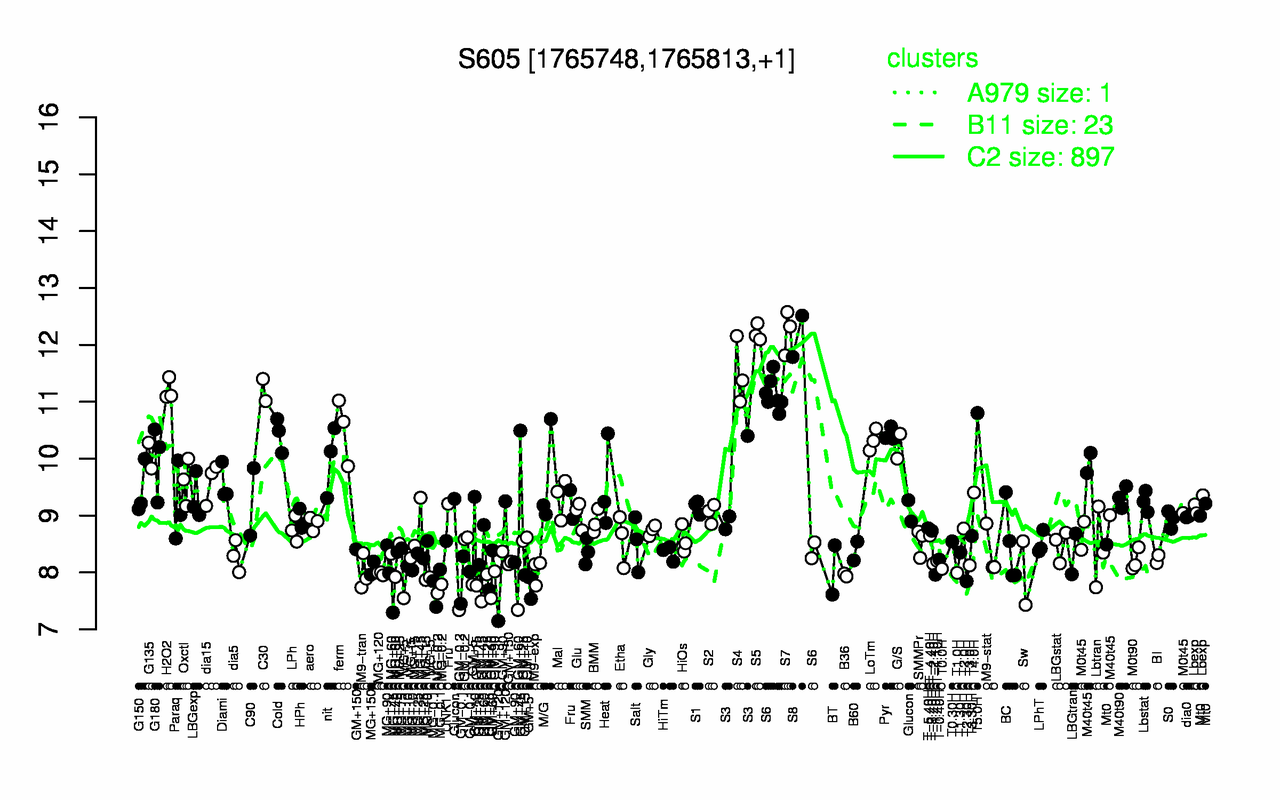
| S7 | S5 | S8 | S4 | H2O2 | C30 | T5.0H | S6 | ferm | Cold |
| 12.2 | 12.2 | 12.2 | 11.5 | 11.2 | 11.2 | 10.8 | 10.5 | 10.5 | 10.4 |
| MG-0.2 | MG+5 | GM+5 | MG-0.1 | GM+15 | T2.30H | GM-0.1 | B36 | T-1.40H | MG+120 |
| 7.71 | 7.73 | 7.75 | 7.77 | 7.81 | 7.84 | 7.91 | 7.95 | 7.96 | 7.98 |