B. subtilis Expression Data Browser
Start Page
B. subtilis Expression Data Browser
Gene/Segment:
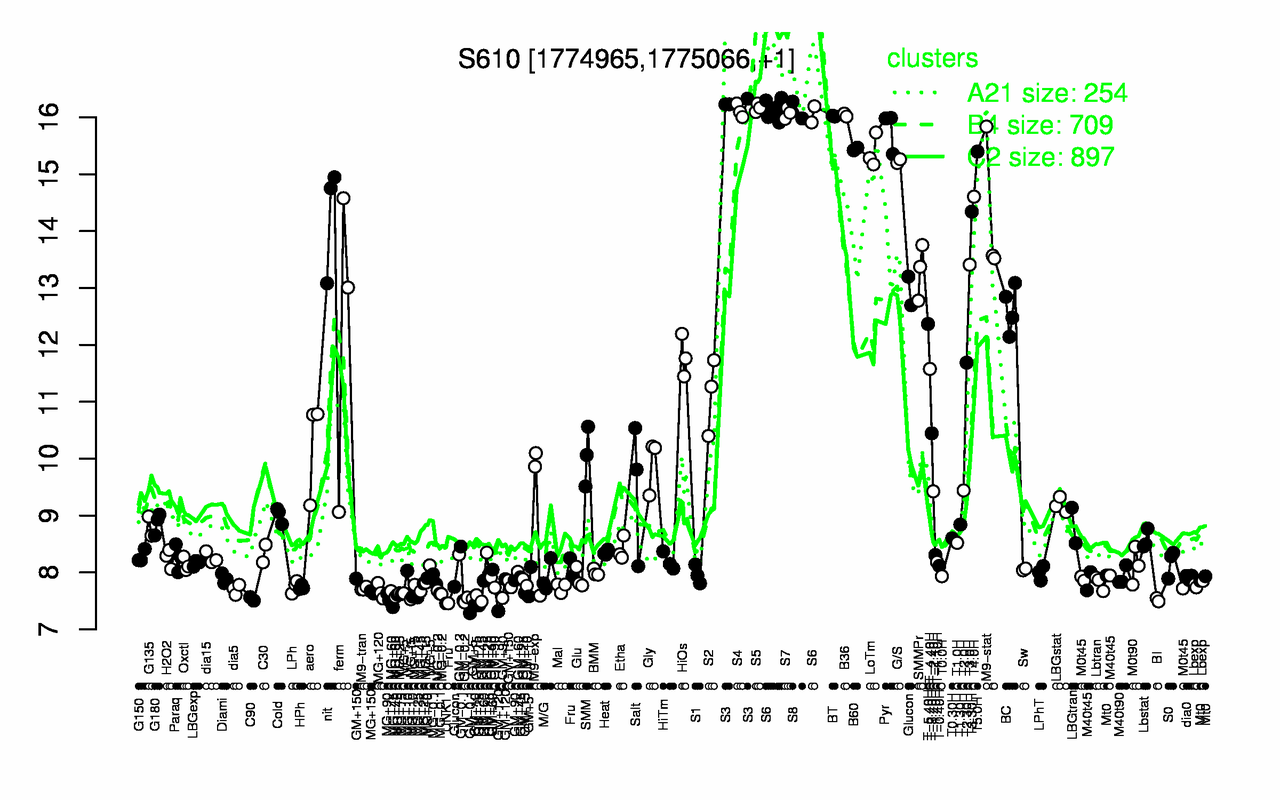
S610
Locus Tag:
new_1774965_1775066
Details about S610
Show/Hide
Highest Expression Conditions
S3
S5
S8
S4
S6
S7
B36
BT
Pyr
B60
16.3
16.2
16.1
16.1
16.1
16.1
16
16
15.8
15.4
Lowest Expression Conditions
UNK1
BI
MG+t5
C90
MG+45
MG+90
GM+10
GM+120
MG+60
MG-0.2
7.46
7.52
7.53
7.54
7.56
7.57
7.6
7.6
7.62
7.65
Most Positively Correlated Segments
cotE
S1463
usd
spoIIID
ywdL
cotJA
S1405
cotJB
cotJC
S246
0.99
0.98
0.98
0.98
0.98
0.98
0.98
0.98
0.98
0.97
Most Negatively Correlated Segments
yddS
yvrG
glnJ
sbcD
S378
yvrH
glnL
ycbL
ycbN
S1129
-0.86
-0.86
-0.85
-0.85
-0.84
-0.83
-0.83
-0.83
-0.83
-0.82
Expression Profile of Segment S610
Show/Hide
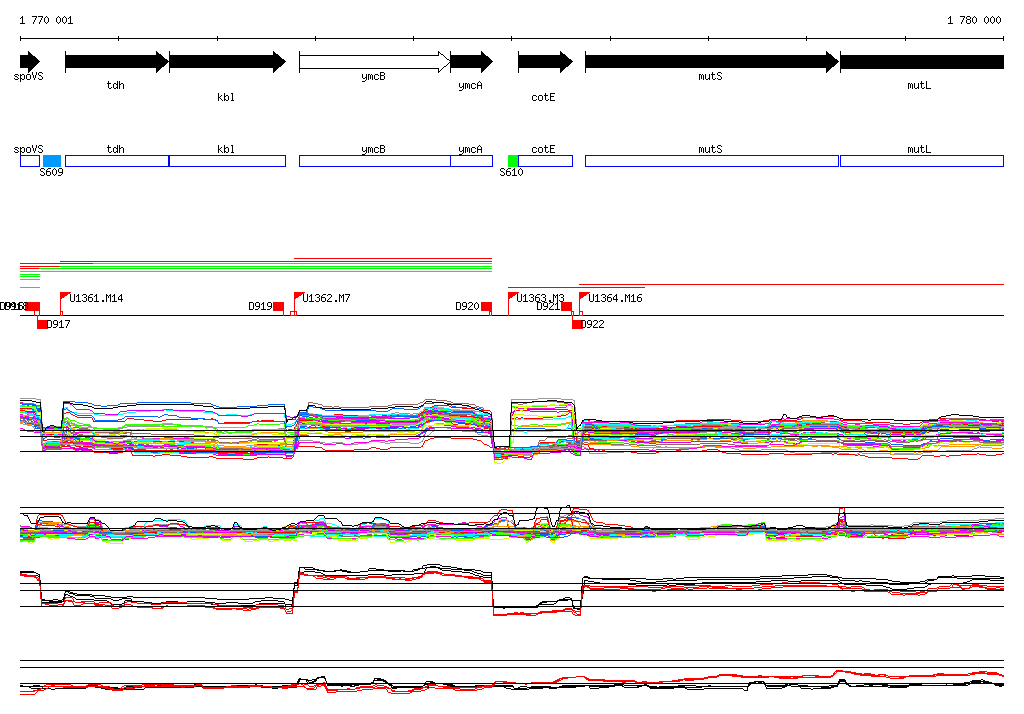
Genomic View of Gene/Segment S610
Show/Hide
(Legend)
Browse Genome Context