B. subtilis Expression Data Browser
Start Page
B. subtilis Expression Data Browser
Gene/Segment:
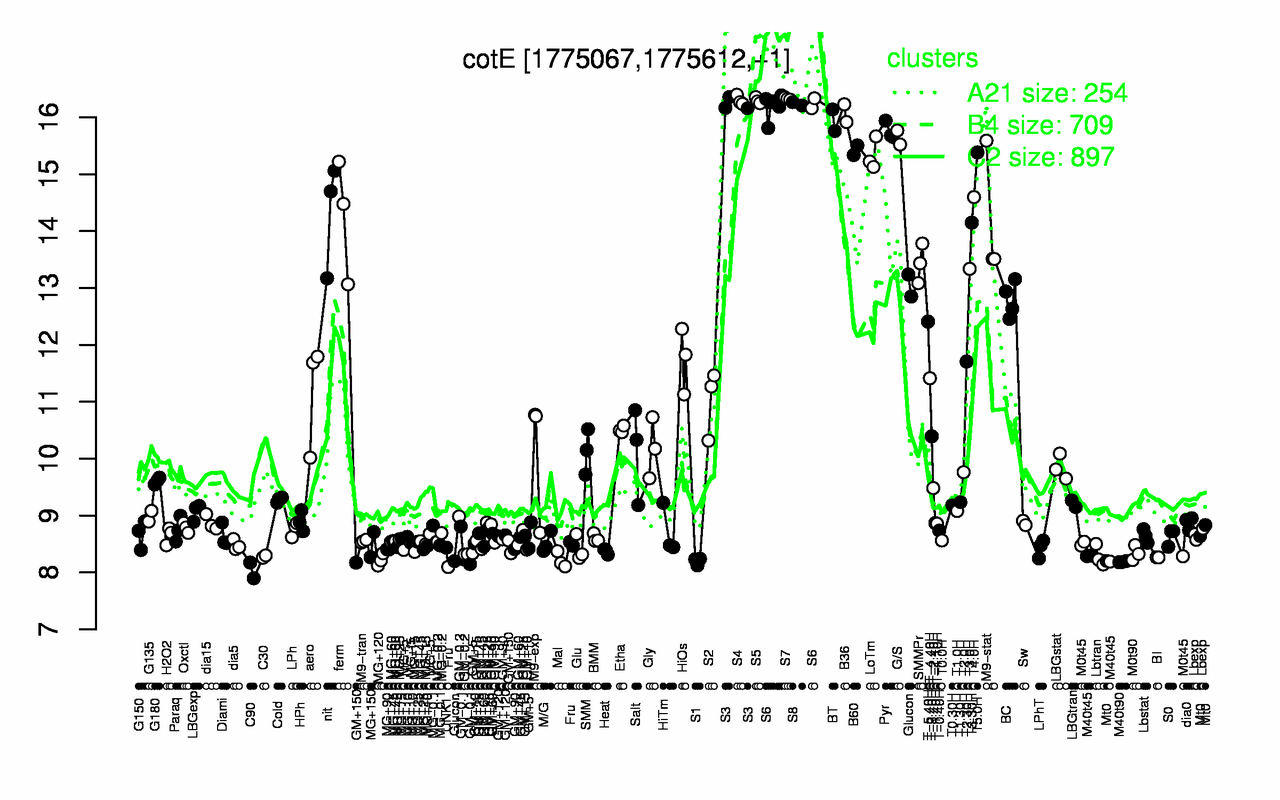
cotE
Locus Tag:
BSU17030
Details about cotE
Show/Hide
Highest Expression Conditions
S7
S4
S5
S8
S3
S6
B36
BT
Pyr
G/S
16.3
16.3
16.3
16.2
16.2
16.2
16.1
15.9
15.8
15.6
Lowest Expression Conditions
C90
M40t90
S1
Mal
MG+120
M40t45
BI
C30
Lbtran
M0t90
8.04
8.19
8.2
8.22
8.22
8.26
8.26
8.28
8.29
8.34
Most Positively Correlated Segments
S1463
usd
ywdL
S610
spoIIID
cotJA
cotJB
S1405
cotJC
S246
0.99
0.99
0.99
0.99
0.99
0.98
0.98
0.98
0.98
0.98
Most Negatively Correlated Segments
sbcD
glnJ
yddS
yvrG
S378
ycbO
ycbN
glnL
brnQ
sbcC
-0.86
-0.86
-0.86
-0.86
-0.85
-0.84
-0.83
-0.83
-0.83
-0.83
Expression Profile of Segment cotE
Show/Hide
Annotation of Gene cotE
Show/Hide
function
16.8: Protect
function
16.13: Shape
function
16.5: Explore
inference
ab initio prediction:AMIGene:2.0
codon_start
1
product
morphogenic spore protein
transl_table
11
note
Evidence 1a: Function experimentally demonstrated in the studied strain; PubMedId: 11737650, 14563859, 14973022, 17172339; Product type cp: cell process
db_xref
GI:2634075
protein_id
CAB13576.1
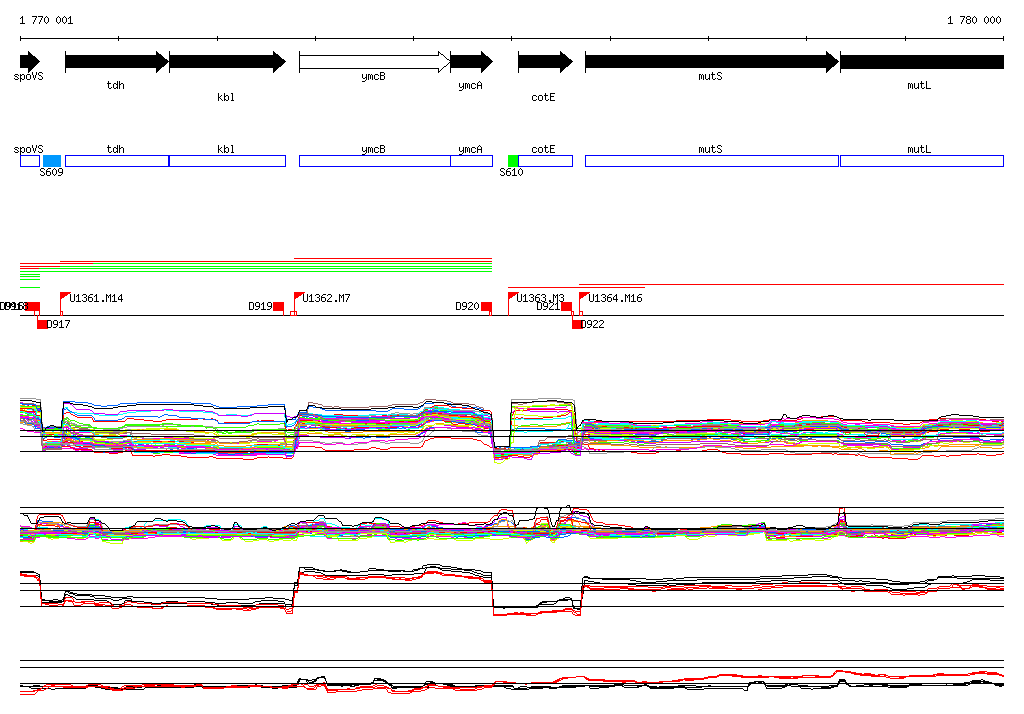
Genomic View of Gene/Segment cotE
Show/Hide
(Legend)
Browse Genome Context