B. subtilis Expression Data Browser
Start Page
B. subtilis Expression Data Browser
Gene/Segment:
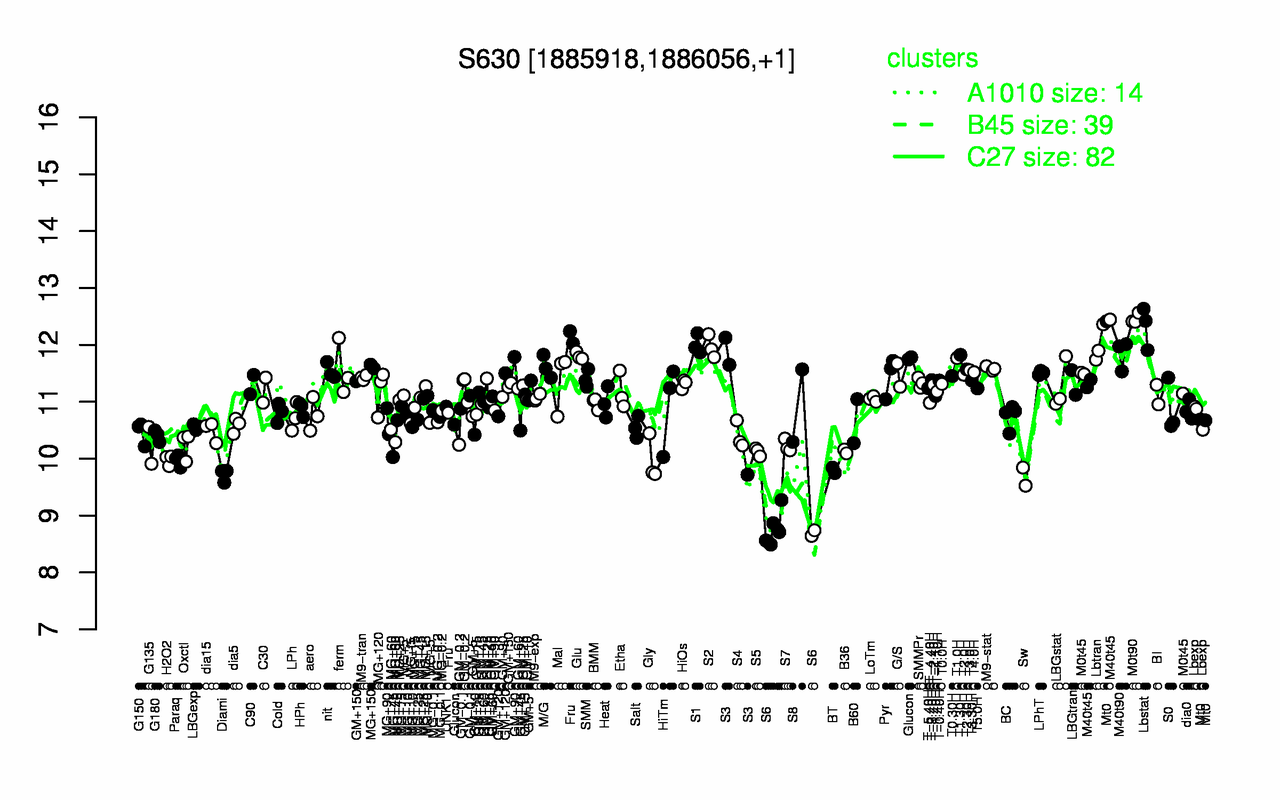
S630
Locus Tag:
new_1885918_1886056
Details about S630
Show/Hide
Highest Expression Conditions
M0t90
Lbstat
S1
Lbtran
S2
M40t90
T1.30H
Glu
T1.0H
M40t45
12.5
12.3
12
12
12
11.8
11.8
11.8
11.8
11.7
Lowest Expression Conditions
S6
Sw
Diami
BT
Paraq
Gly
H2O2
S5
B36
S7
8.73
9.68
9.72
9.8
9.97
9.98
9.98
10.1
10.1
10.2
Most Positively Correlated Segments
ynzI
ynaI
ynaG
ynaF
S629
ynaE
yopC
S628
S713
yokJ
0.99
0.96
0.95
0.93
0.91
0.9
0.86
0.85
0.82
0.8
Most Negatively Correlated Segments
helD
yfiU
S1432
ywkF
S1280
S1520
S1573
S863
yybP
yvaC
-0.73
-0.69
-0.69
-0.68
-0.66
-0.66
-0.66
-0.66
-0.64
-0.64
Expression Profile of Segment S630
Show/Hide
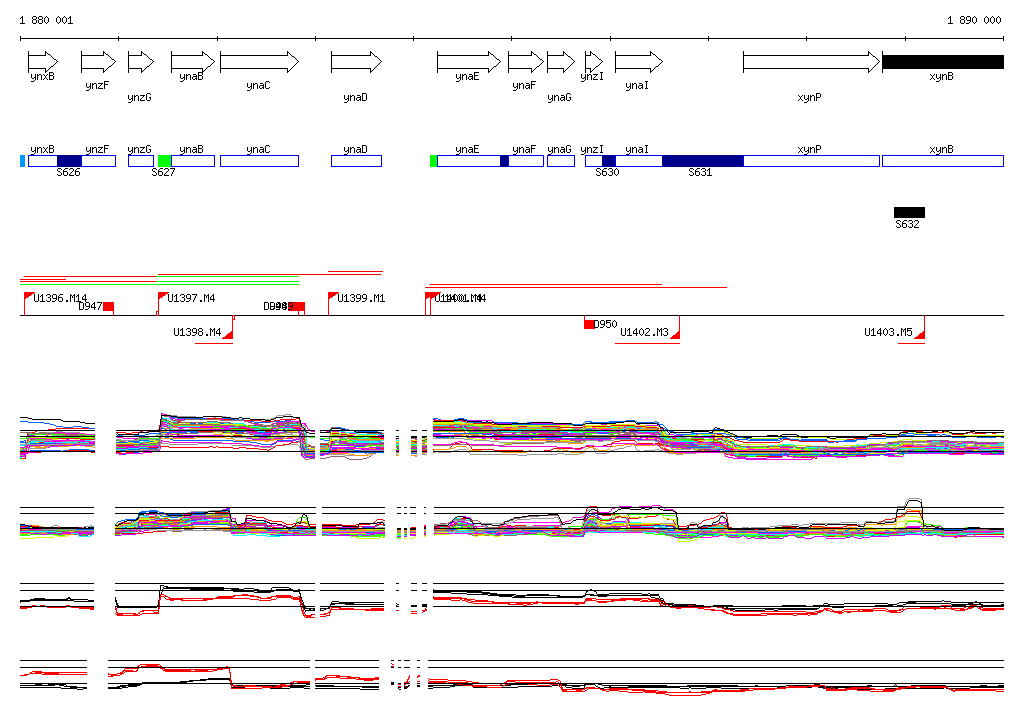
Genomic View of Gene/Segment S630
Show/Hide
(Legend)
Browse Genome Context