| Start Page |
|
 |
| Start Page |
|
|
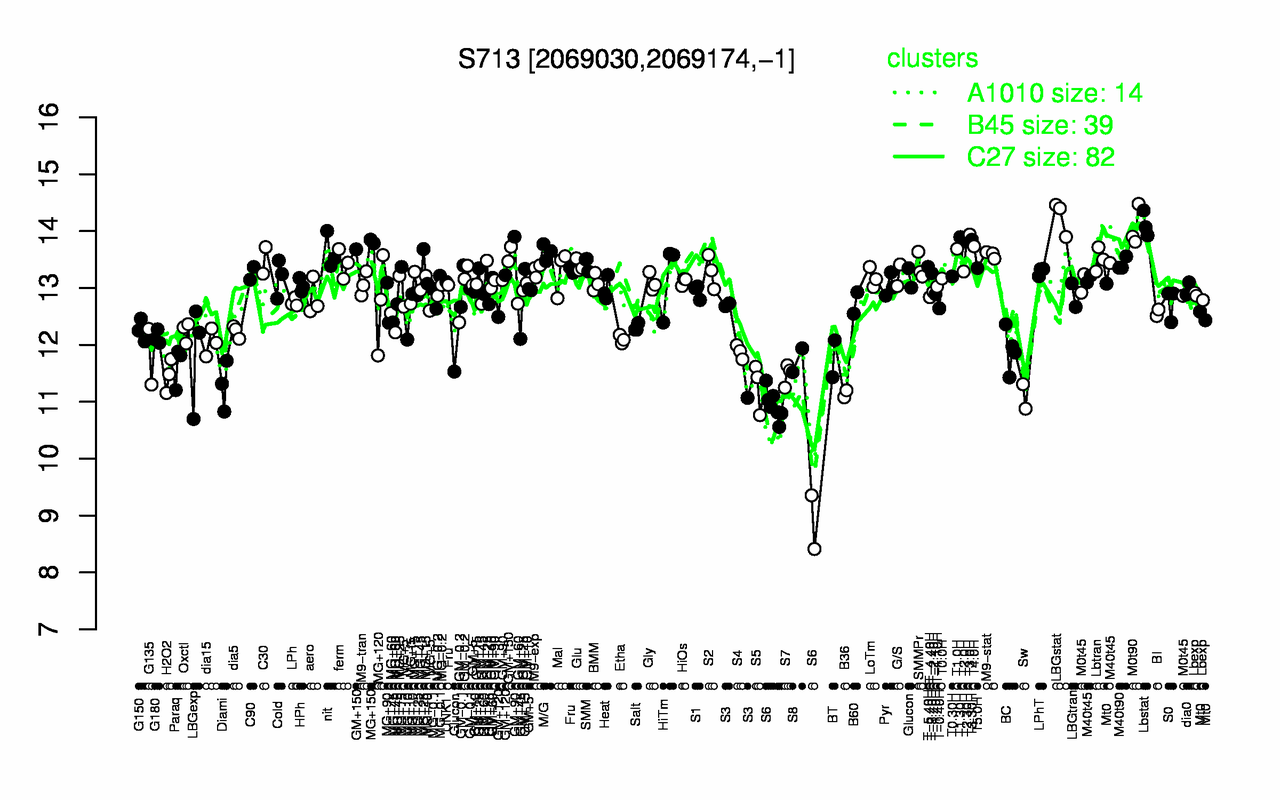
| LBGstat | Lbstat | M0t90 | T3.0H | T1.30H | T3.30H | MG+150 | T2.30H | T4.0H | T1.0H |
| 14.3 | 14.1 | 14.1 | 13.9 | 13.9 | 13.9 | 13.8 | 13.8 | 13.7 | 13.7 |
| S6 | Sw | B36 | S5 | Diami | H2O2 | S7 | Paraq | S8 | BT |
| 10.5 | 11.1 | 11.1 | 11.3 | 11.3 | 11.5 | 11.5 | 11.6 | 11.7 | 11.8 |