| Start Page |
|
 |
| Start Page |
|
|
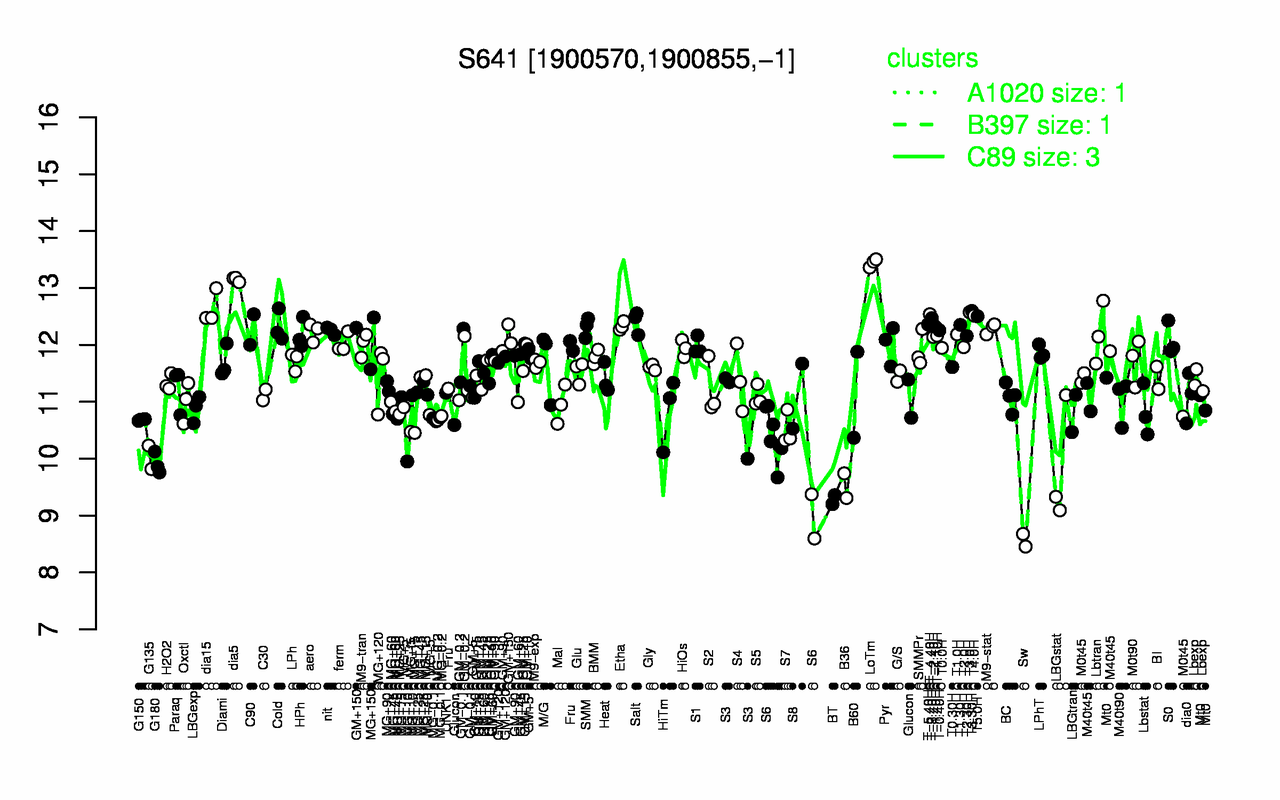
| LoTm | dia5 | dia15 | T3.30H | T3.0H | T-4.40H | T4.0H | T5.0H | T-3.40H | Salt |
| 13.4 | 13.2 | 12.6 | 12.6 | 12.6 | 12.5 | 12.5 | 12.5 | 12.5 | 12.4 |
| Sw | BT | B36 | LBGstat | G180 | G135 | S6 | MG+t5 | S7 | G150 |
| 8.57 | 9.28 | 9.52 | 9.85 | 9.91 | 10 | 10.1 | 10.5 | 10.5 | 10.7 |