B. subtilis Expression Data Browser
Start Page
B. subtilis Expression Data Browser
Gene/Segment:
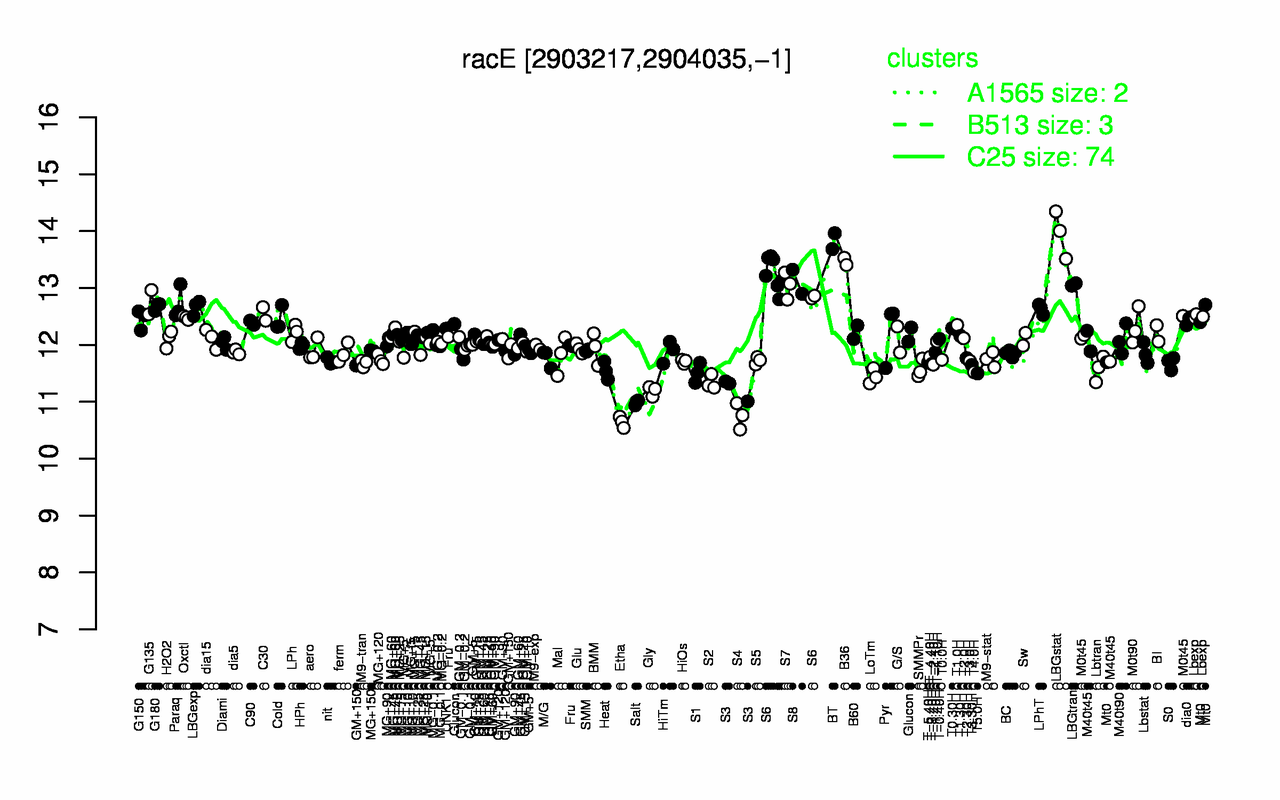
racE
Locus Tag:
BSU28390
Details about racE
Show/Hide
Highest Expression Conditions
LBGstat
BT
B36
S6
S8
LBGtran
S7
G135
Paraq
G180
14
13.8
13.5
13.2
13.1
13.1
13
12.8
12.7
12.7
Lowest Expression Conditions
Etha
S4
Salt
Gly
S3
S2
LoTm
T5.0H
S1
T4.0H
10.6
10.8
11
11.2
11.2
11.3
11.4
11.5
11.5
11.5
Most Positively Correlated Segments
ysmB
yjqC
S1432
cotD
ywkF
holA
ispH
ytwI
murAA
yuzE
0.93
0.73
0.7
0.68
0.68
0.67
0.64
0.64
0.64
0.64
Most Negatively Correlated Segments
ynaD
rapI
bsaA
S824
yusY
S541
ywfH
ylmA
ypgQ
ytxG
-0.64
-0.61
-0.61
-0.6
-0.58
-0.58
-0.57
-0.55
-0.55
-0.54
Expression Profile of Segment racE
Show/Hide
Annotation of Gene racE
Show/Hide
function
16.13: Shape
function
16.6: Maintain
function
16.2: Construct biomass (Anabolism)
inference
ab initio prediction:AMIGene:2.0
codon_start
1
EC_number
5.1.1.3
transl_table
11
note
Evidence 2a: Function of homologous gene experimentally demonstrated in an other organism; PubMedId: 15347750; Product type e: enzyme
db_xref
GI:225185282
product
glutamate racemase
protein_id
CAB14799.2
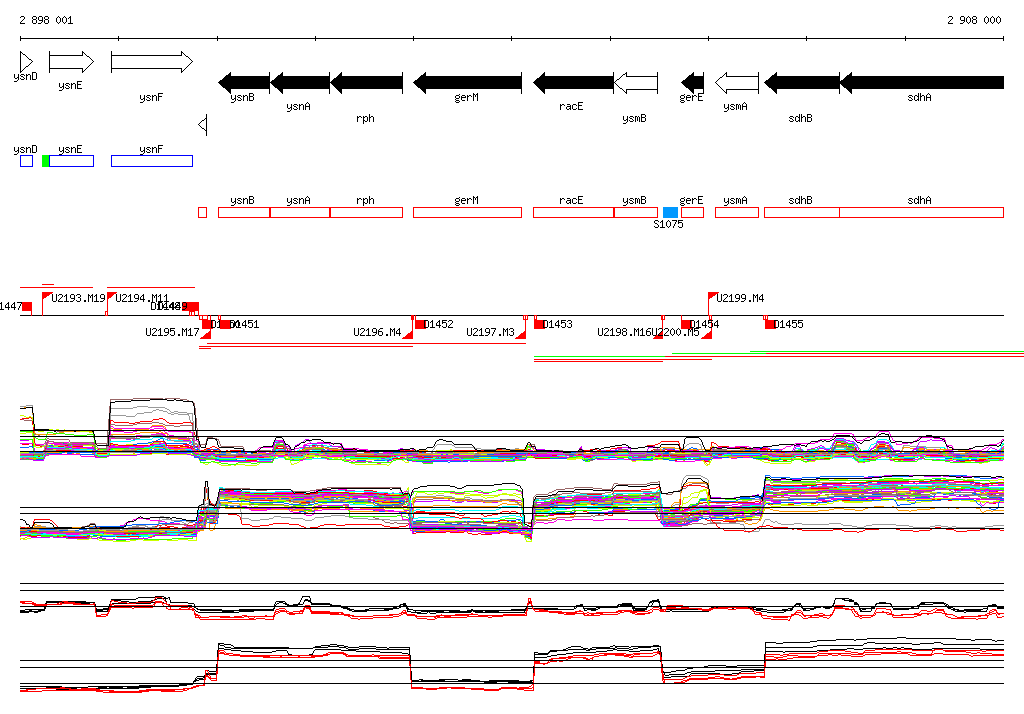
Genomic View of Gene/Segment racE
Show/Hide
(Legend)
Browse Genome Context