| Start Page |
|
 |
| Start Page |
|
|
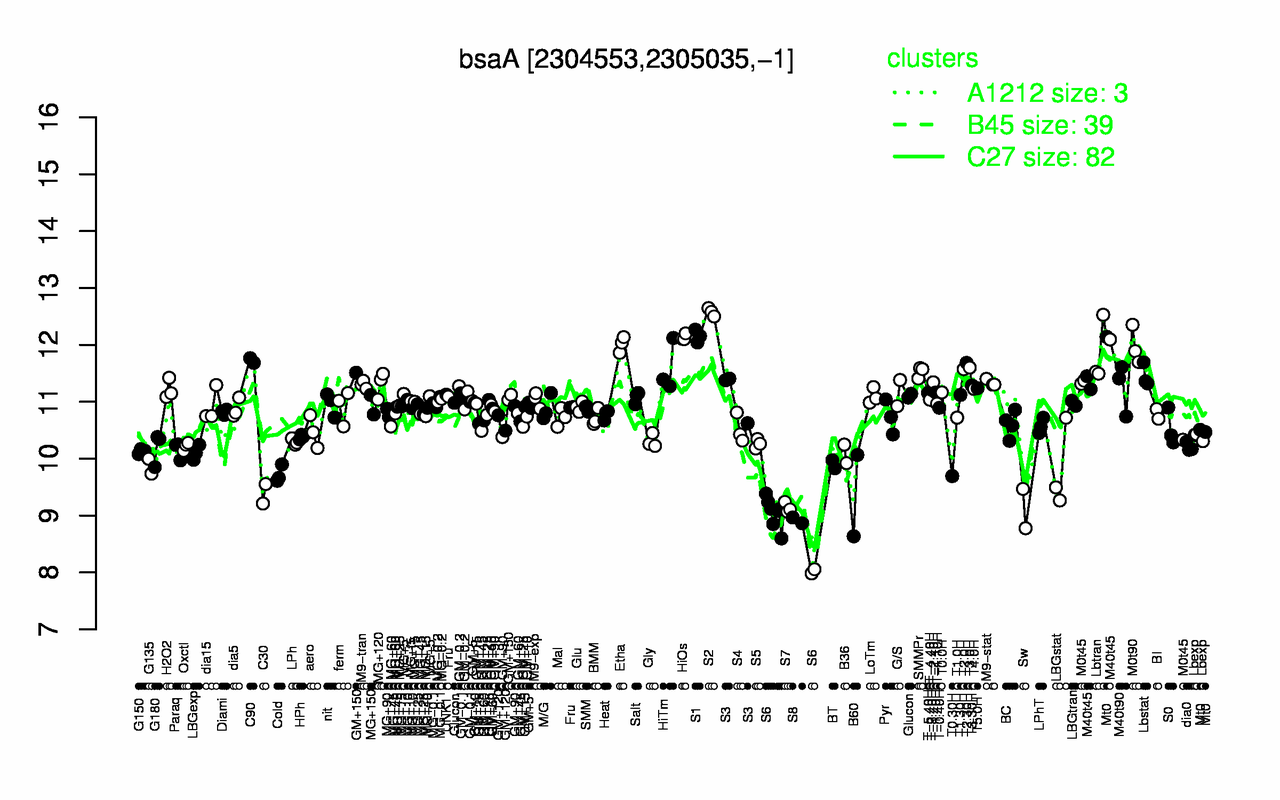
| S2 | S1 | HiOs | Etha | M0t90 | Lbtran | C90 | T2.30H | T3.0H | HiTm |
| 12.6 | 12.2 | 12.1 | 12 | 12 | 11.9 | 11.7 | 11.7 | 11.6 | 11.6 |
| S6 | S8 | Sw | S7 | B60 | C30 | T0.30H | Cold | LBGstat | G135 |
| 8.83 | 8.92 | 9.12 | 9.14 | 9.35 | 9.38 | 9.69 | 9.72 | 9.83 | 9.87 |