B. subtilis Expression Data Browser
Start Page
B. subtilis Expression Data Browser
Gene/Segment:
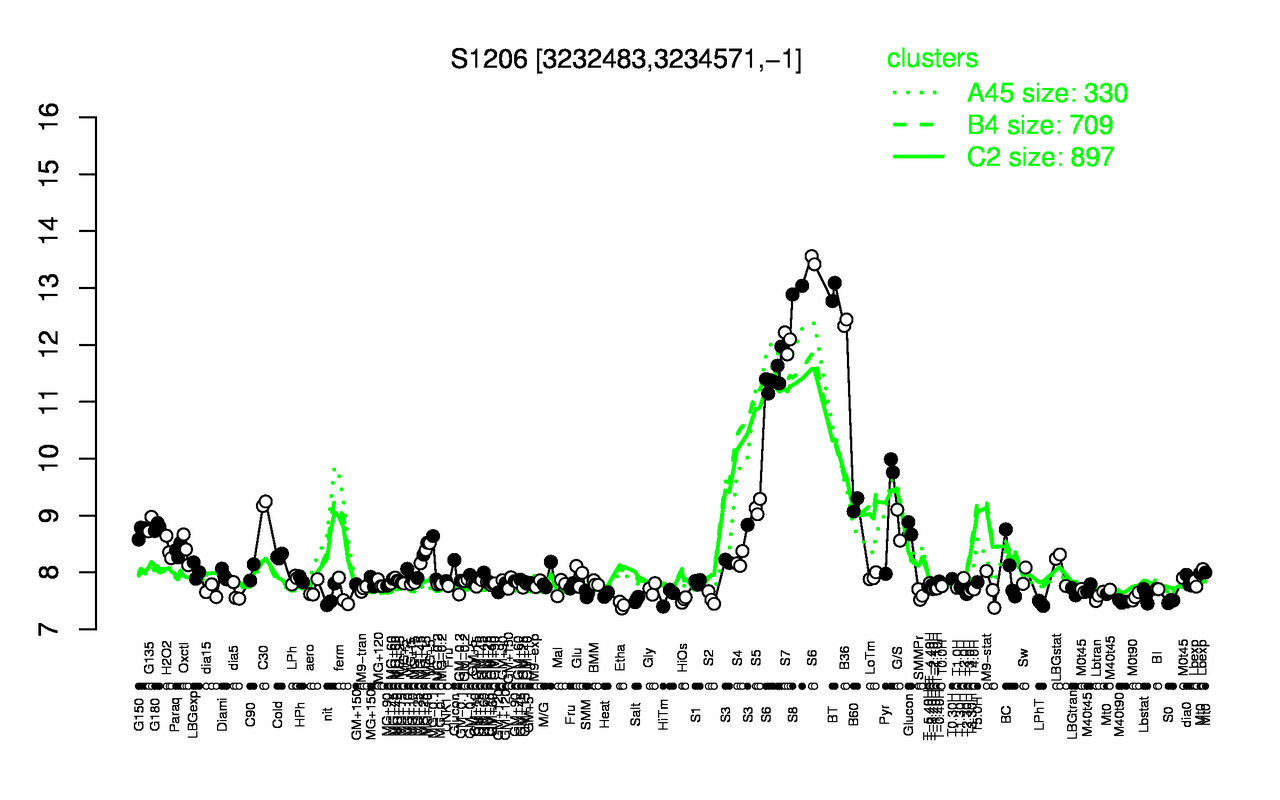
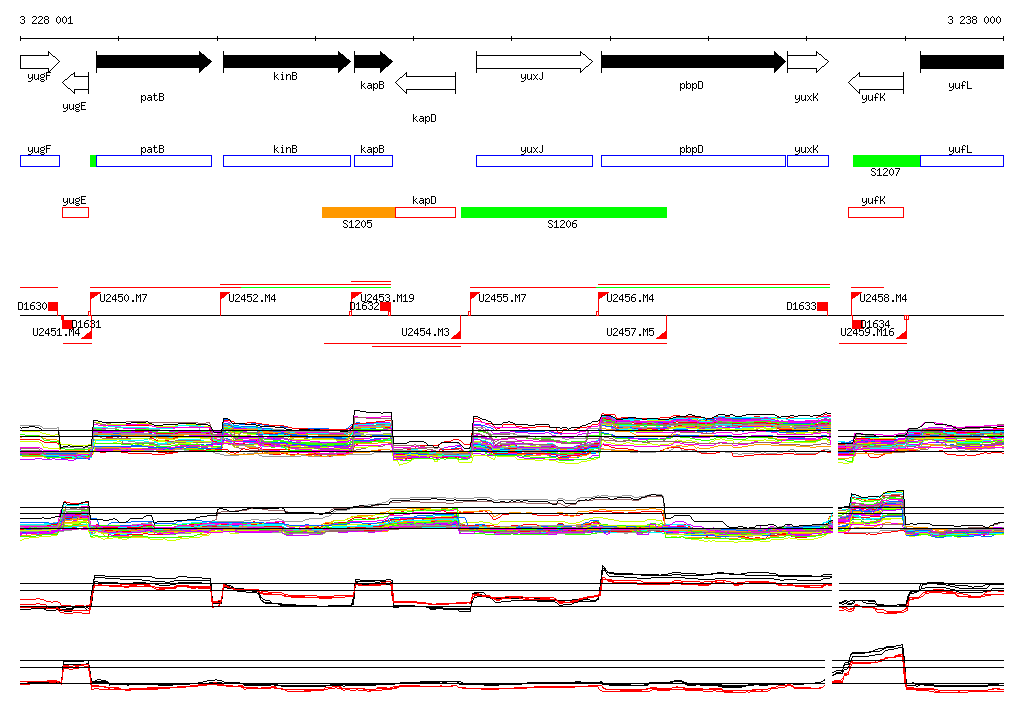
S1206
Locus Tag:
new_3232483_3234571_c
Details about S1206
Show/Hide
Highest Expression Conditions
S8
BT
B36
S7
S6
Pyr
C30
B60
S5
G135
13
12.9
12.4
12.1
11.9
9.24
9.21
9.19
9.15
8.85
Lowest Expression Conditions
Etha
LPhT
M40t90
S0
HiOs
Salt
S2
M0t90
nit
HiTm
7.43
7.46
7.49
7.49
7.52
7.52
7.55
7.57
7.58
7.58
Most Positively Correlated Segments
S1317
S729
yfnD
S757
S1266
cotR
yodH
S1264
yjzB
S1316
0.95
0.94
0.93
0.93
0.93
0.93
0.93
0.93
0.92
0.92
Most Negatively Correlated Segments
ykuH
S511
yusH
parA
yobL
S1125
S1047
comN
yqgA
ptkA
-0.83
-0.83
-0.81
-0.8
-0.79
-0.79
-0.78
-0.78
-0.78
-0.77
Expression Profile of Segment S1206
Show/Hide
Genomic View of Gene/Segment S1206
Show/Hide
(Legend)
Browse Genome Context