B. subtilis Expression Data Browser
Start Page
B. subtilis Expression Data Browser
Gene/Segment:
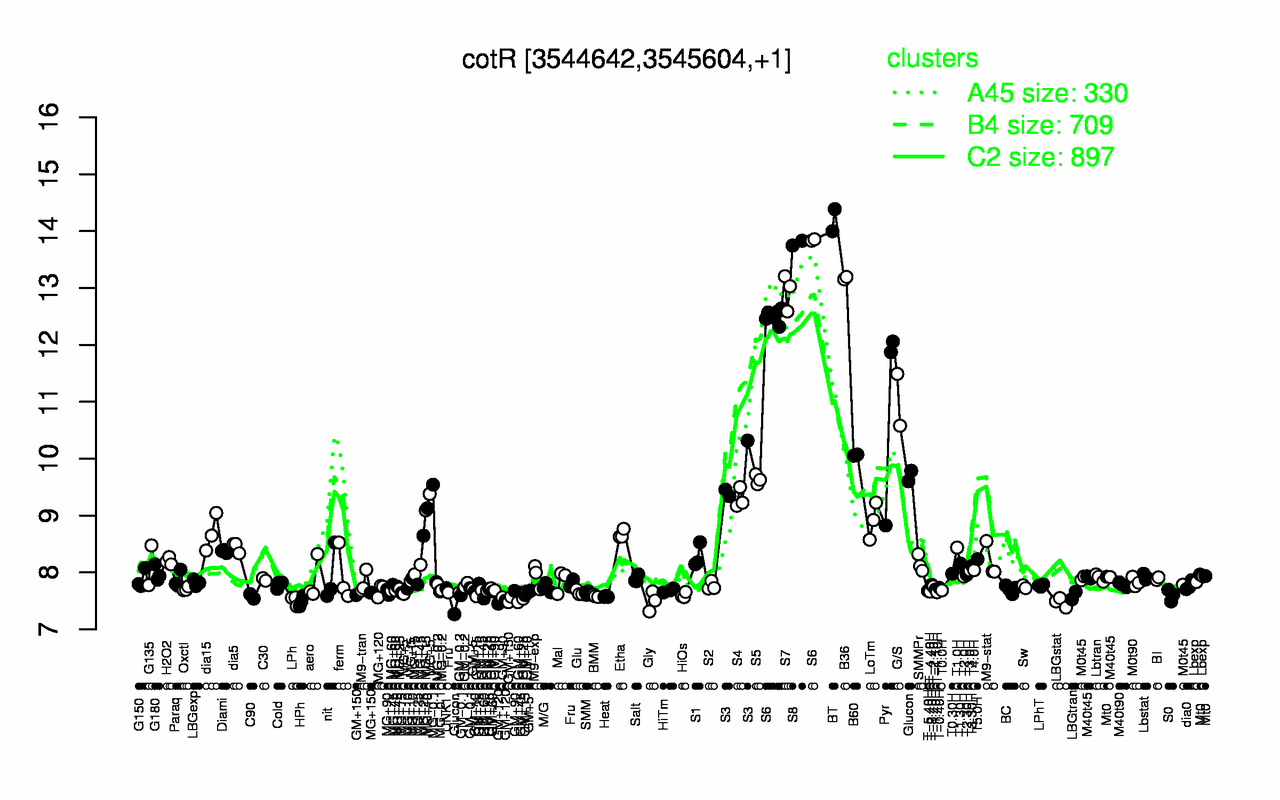
cotR
Locus Tag:
BSU34530
Details about cotR
Show/Hide
Highest Expression Conditions
BT
S8
B36
S7
S6
G/S
Pyr
B60
S3
S5
14.2
13.8
13.2
12.9
12.8
11
10.9
10.1
9.7
9.63
Lowest Expression Conditions
LBGstat
GM+120
HPh
Gly
LPh
GM+150
GM+60
Heat
C90
BMM
7.47
7.48
7.5
7.5
7.51
7.55
7.56
7.58
7.58
7.59
Most Positively Correlated Segments
S1317
S729
yfnE
spsE
spsF
spsC
spsB
spsD
spsG
spsA
0.98
0.96
0.96
0.95
0.95
0.95
0.95
0.95
0.95
0.95
Most Negatively Correlated Segments
ykuH
S511
yeaC
S1125
ptkA
ywqC
parA
ezrA
pbpD
yvpB
-0.83
-0.82
-0.81
-0.81
-0.81
-0.8
-0.79
-0.79
-0.79
-0.79
Expression Profile of Segment cotR
Show/Hide
Annotation of Gene cotR
Show/Hide
function
16.13: Shape
function
16.8: Protect
inference
ab initio prediction:AMIGene:2.0
codon_start
1
product
spore coat protein assembly factor CotR
transl_table
11
note
Evidence 1a: Function experimentally demonstrated in the studied strain; PubMedId: 11737650; Product type f: factor
db_xref
GI:2635966
protein_id
CAB15458.1
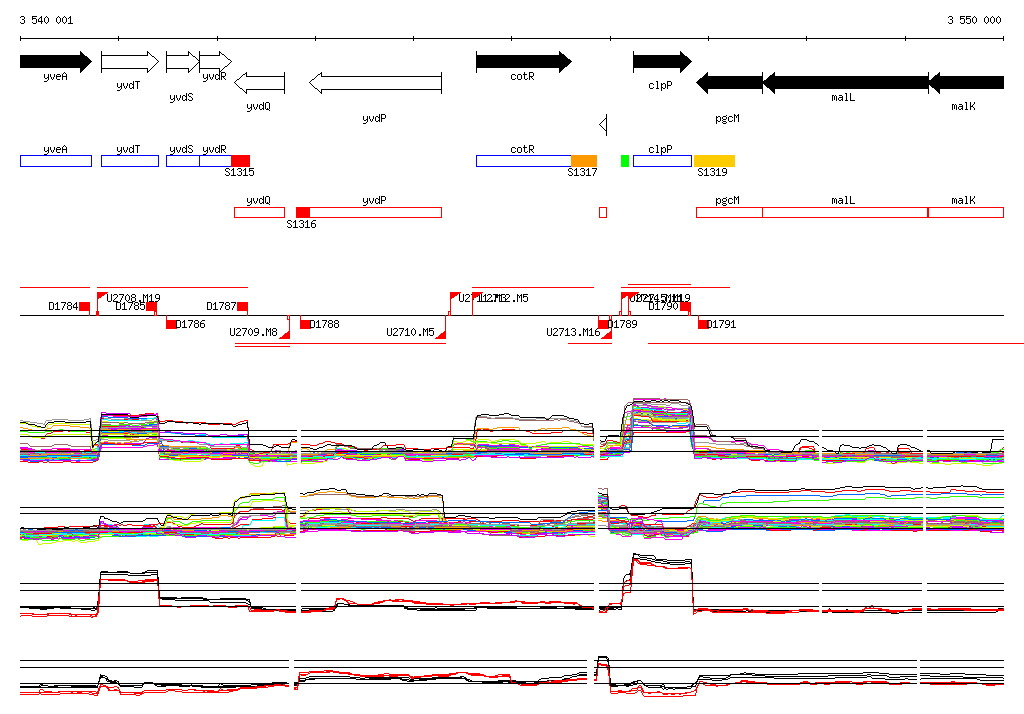
Genomic View of Gene/Segment cotR
Show/Hide
(Legend)
Browse Genome Context