B. subtilis Expression Data Browser
Start Page
B. subtilis Expression Data Browser
Gene/Segment:
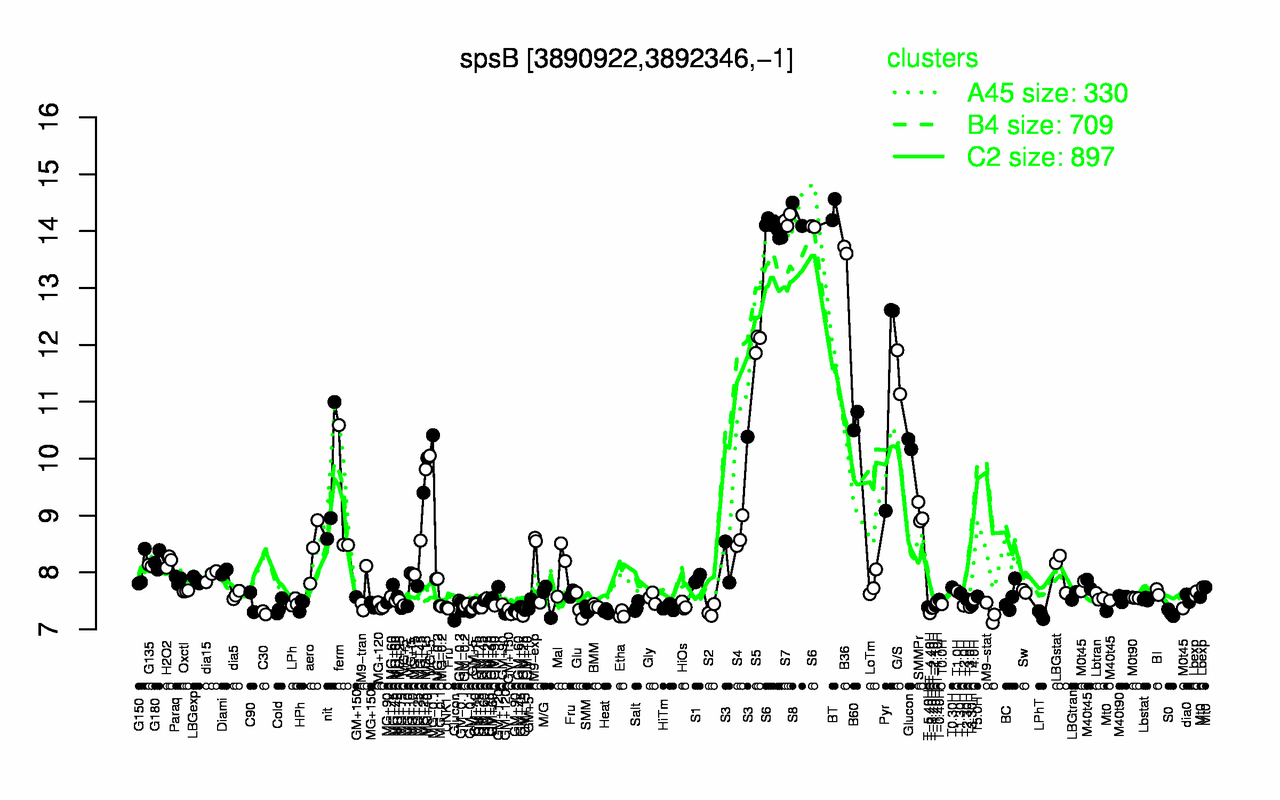
spsB
Locus Tag:
BSU37900
Details about spsB
Show/Hide
Highest Expression Conditions
BT
S8
S7
S6
B36
S5
G/S
Pyr
B60
nit
14.4
14.3
14.2
14.1
13.7
12
11.5
11.4
10.7
9.51
Lowest Expression Conditions
LPhT
Etha
M9-stat
T-4.40H
S0
C30
Heat
S2
SMM
T-3.40H
7.26
7.26
7.28
7.28
7.29
7.29
7.32
7.32
7.34
7.37
Most Positively Correlated Segments
spsA
spsC
spsD
spsE
spsF
spsG
yfnE
spoVFA
S598
spoVFB
1
1
1
0.99
0.99
0.99
0.98
0.98
0.98
0.98
Most Negatively Correlated Segments
ykuH
bceR
S511
aroC
bceS
yeaC
S1189
ptkA
ydfL
parA
-0.83
-0.82
-0.81
-0.8
-0.79
-0.79
-0.78
-0.78
-0.78
-0.78
Expression Profile of Segment spsB
Show/Hide
Annotation of Gene spsB
Show/Hide
function
16.5: Explore
function
16.8: Protect
function
16.13: Shape
inference
ab initio prediction:AMIGene:2.0
codon_start
1
product
putative dTDP glycosyl/glycerophosphate transferase
transl_table
11
note
Evidence 3: Function proposed based on presence of conserved amino acid motif, structural feature or limited homology; Product type pe: putative enzyme
db_xref
GI:225185425
protein_id
CAB15816.2
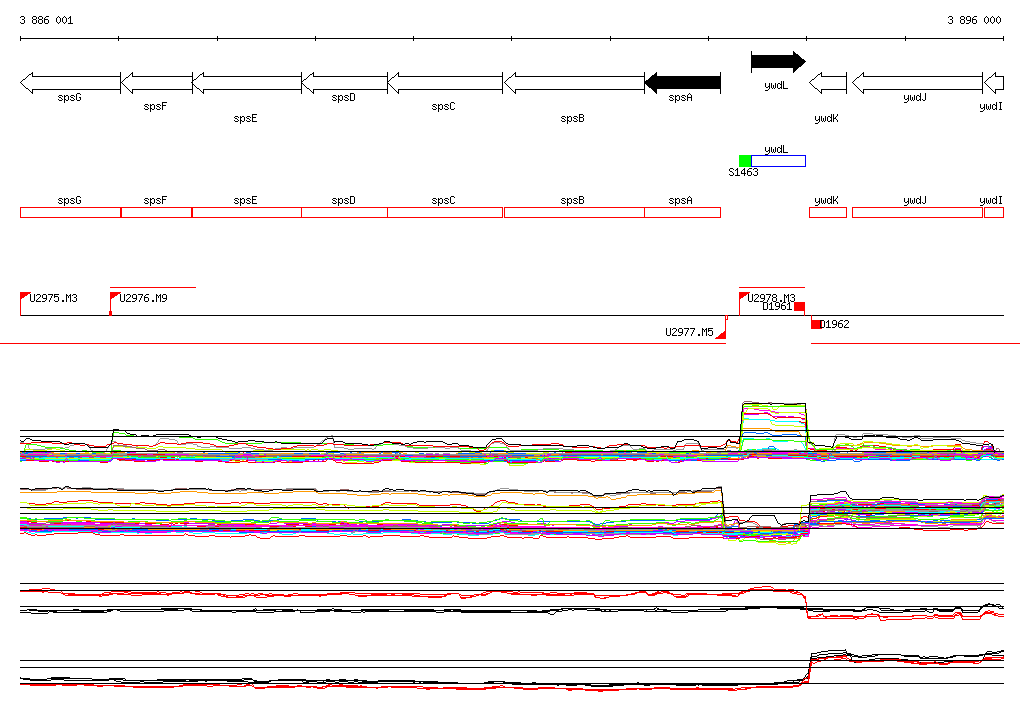
Genomic View of Gene/Segment spsB
Show/Hide
(Legend)
Browse Genome Context