| Start Page |
|
 |
| Start Page |
|
|
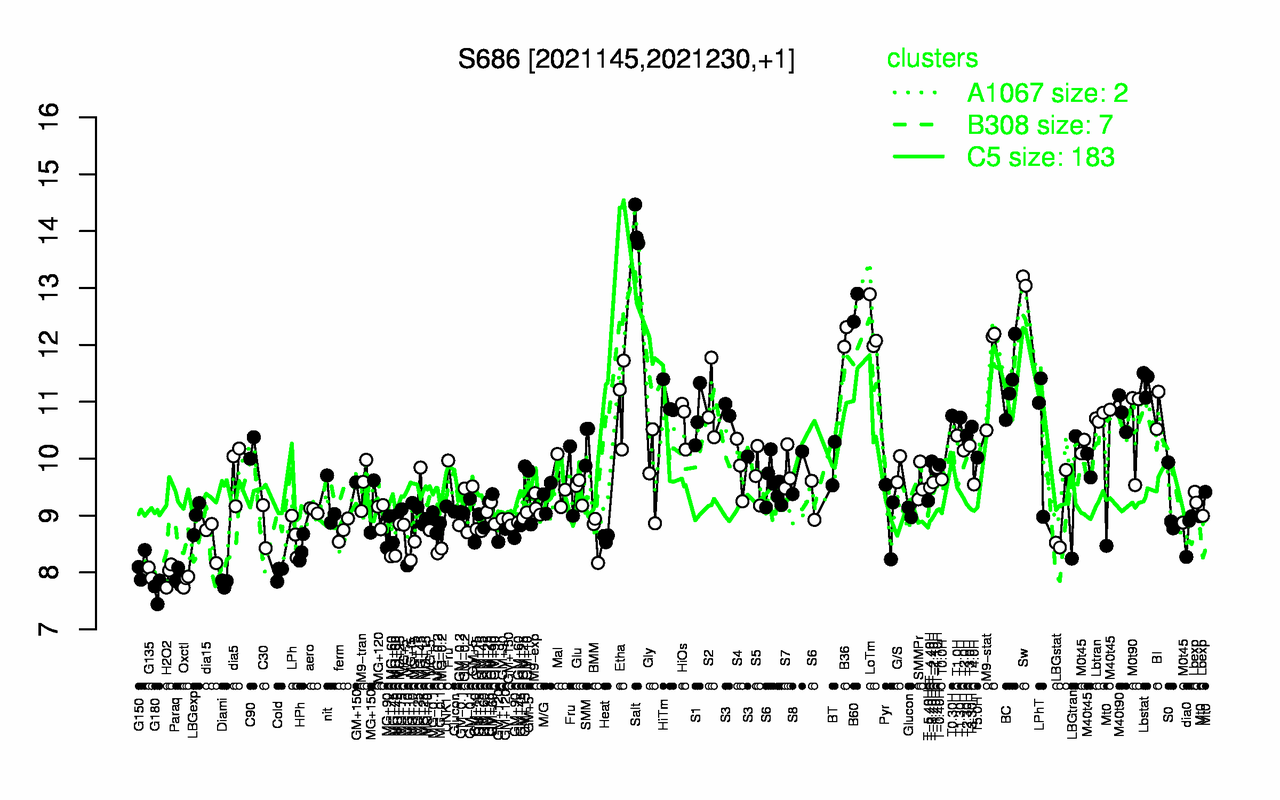
| Salt | Sw | B60 | LoTm | B36 | M9-stat | BC | Lbstat | HiTm | Etha |
| 14 | 13.1 | 12.7 | 12.3 | 12.1 | 11.6 | 11.4 | 11.3 | 11 | 11 |
| G180 | Diami | Oxctl | Paraq | H2O2 | Cold | G135 | G150 | MG+t5 | MG+60 |
| 7.69 | 7.81 | 7.85 | 7.9 | 7.97 | 7.99 | 7.99 | 8.12 | 8.21 | 8.29 |