| Start Page |
|
 |
| Start Page |
|
|
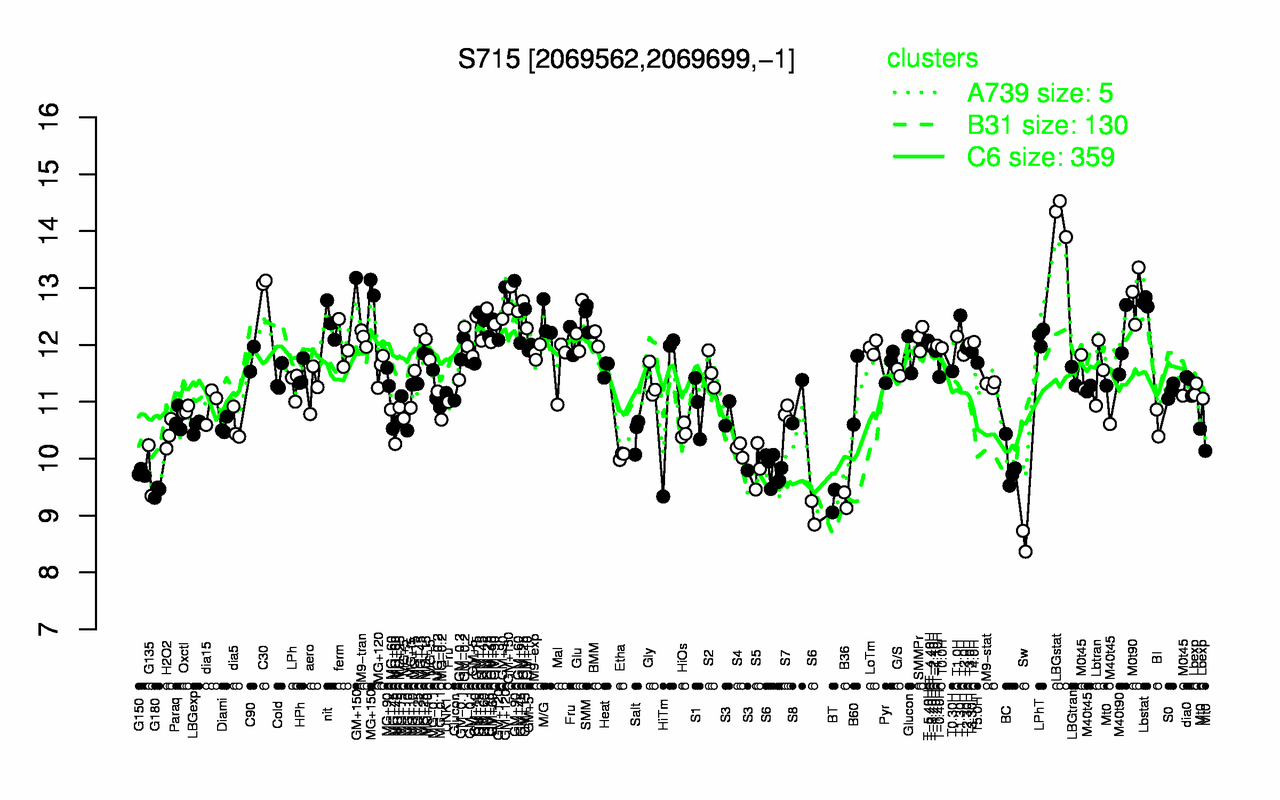
| LBGstat | C30 | MG+150 | GM+150 | M0t90 | Lbstat | GM+25 | GM+90 | GM+120 | T1.30H |
| 14.3 | 13.1 | 13 | 12.9 | 12.9 | 12.8 | 12.7 | 12.6 | 12.6 | 12.5 |
| Sw | BT | B36 | G180 | S6 | G150 | G135 | S5 | BC | Etha |
| 8.55 | 9.25 | 9.27 | 9.42 | 9.63 | 9.75 | 9.79 | 9.85 | 9.88 | 10.1 |