| Start Page |
|
 |
| Start Page |
|
|
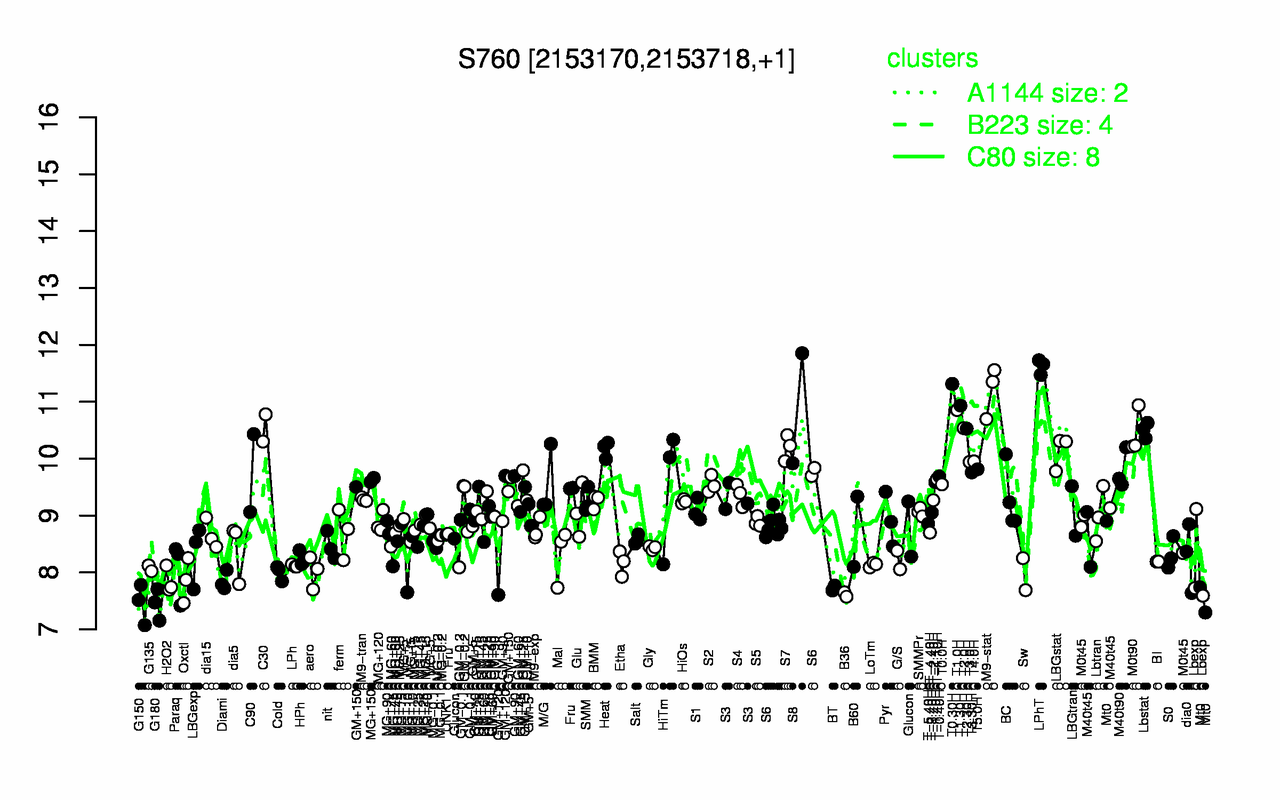
| LPhT | T0.30H | M9-stat | T1.30H | S8 | T1.0H | C30 | T2.0H | T2.30H | Lbstat |
| 11.6 | 11.3 | 11.2 | 10.9 | 10.9 | 10.9 | 10.5 | 10.5 | 10.5 | 10.5 |
| G180 | G150 | B36 | BT | Diami | H2O2 | Oxctl | Sw | Mt0 | Cold |
| 7.44 | 7.46 | 7.61 | 7.73 | 7.85 | 7.85 | 7.86 | 7.97 | 7.98 | 8 |