| Start Page |
|
 |
| Start Page |
|
|
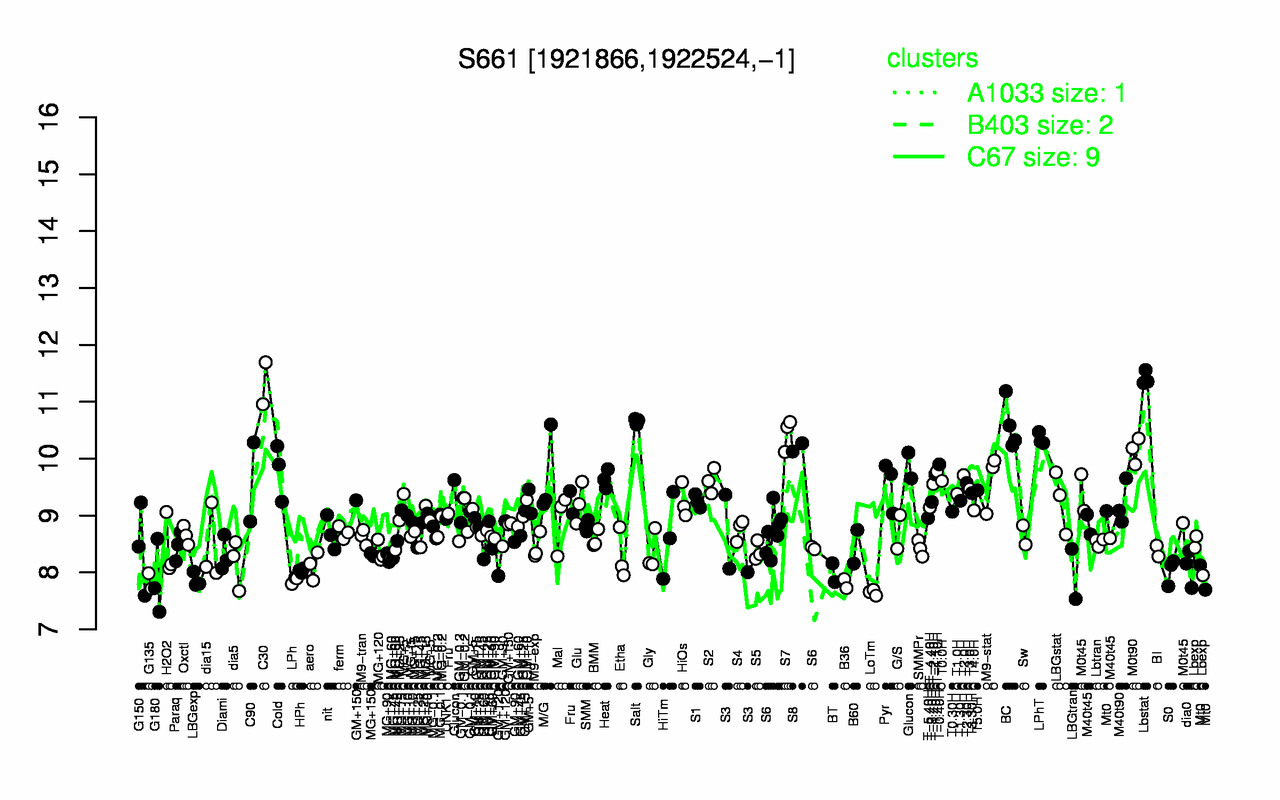
| Lbstat | C30 | Salt | BC | S7 | LPhT | S8 | M0t90 | T-0.40H | Glucon |
| 11.4 | 11.3 | 10.7 | 10.6 | 10.4 | 10.3 | 10.2 | 10.1 | 9.9 | 9.79 |
| LoTm | B36 | G135 | LPh | LBGexp | G180 | LBGtran | BT | S0 | HPh |
| 7.65 | 7.8 | 7.85 | 7.87 | 7.87 | 7.88 | 7.97 | 8 | 8.03 | 8.03 |