| Start Page |
|
 |
| Start Page |
|
|
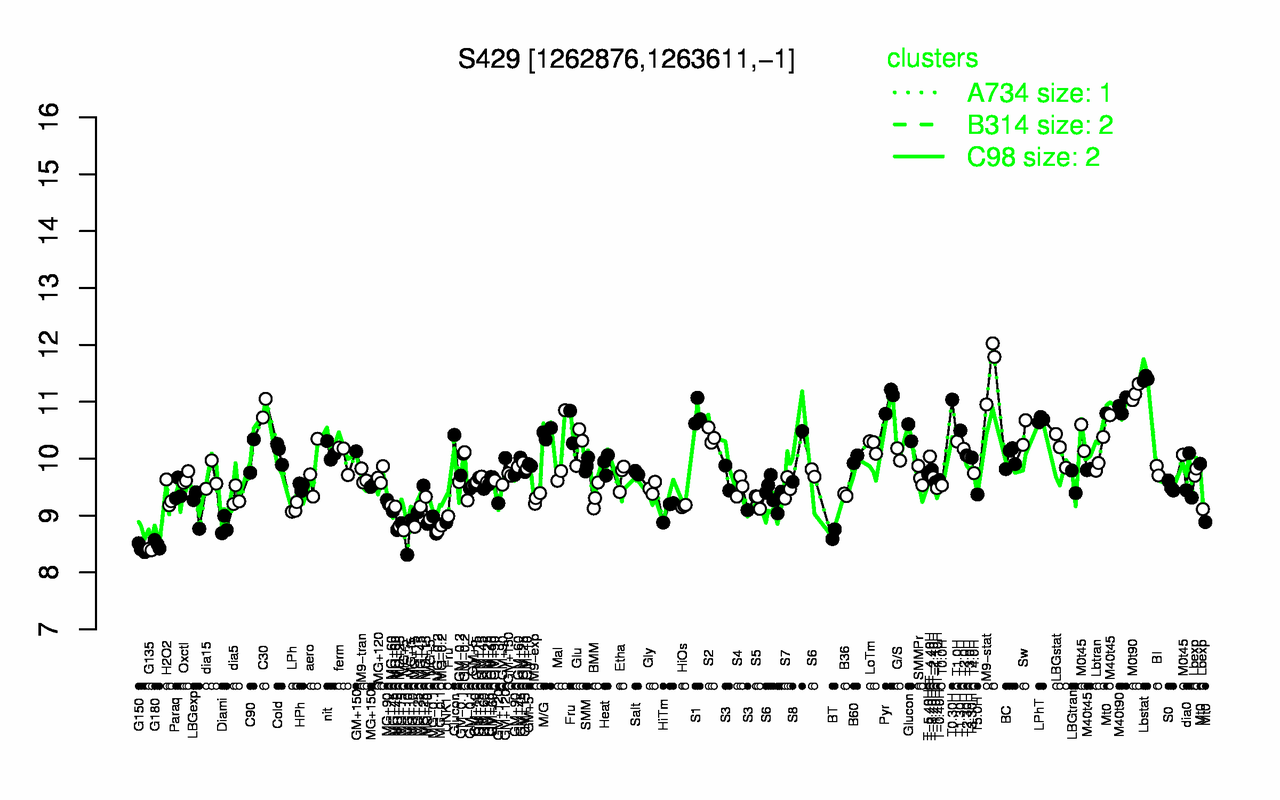
| M9-stat | Lbstat | M0t90 | Pyr | T0.30H | M40t90 | C30 | S1 | LPhT | T1.30H |
| 11.6 | 11.4 | 11.2 | 11 | 11 | 10.9 | 10.9 | 10.8 | 10.7 | 10.5 |
| G135 | G150 | G180 | BT | MG+10 | MG-0.2 | Diami | MG-0.1 | MG+5 | UNK1 |
| 8.4 | 8.43 | 8.5 | 8.67 | 8.69 | 8.77 | 8.81 | 8.84 | 8.84 | 8.88 |