| Start Page |
|
 |
| Start Page |
|
|
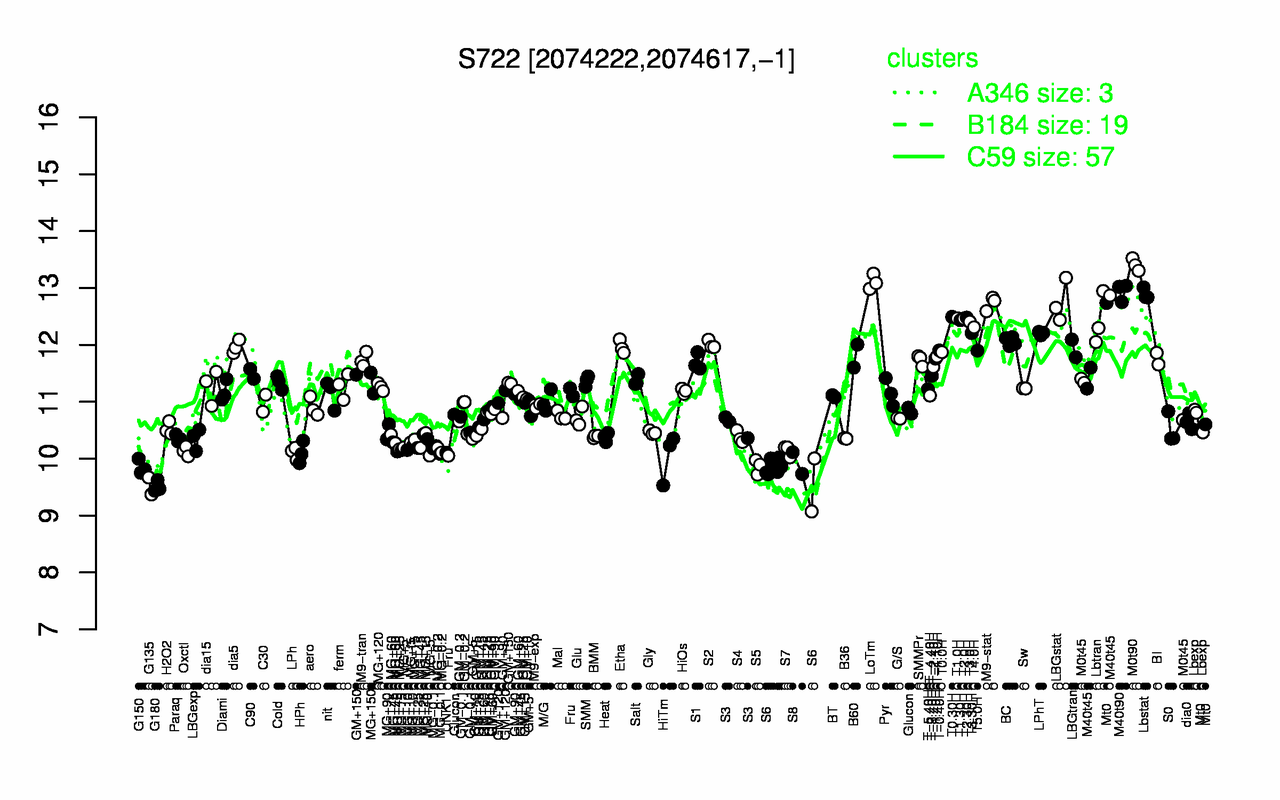
| M0t90 | LoTm | M40t90 | Lbstat | LBGstat | M9-stat | T0.30H | T2.30H | T1.0H | T2.0H |
| 13.4 | 13.1 | 12.9 | 12.9 | 12.8 | 12.7 | 12.5 | 12.5 | 12.5 | 12.5 |
| G180 | G135 | S6 | G150 | S5 | S8 | HiTm | LPh | UNK1 | HPh |
| 9.51 | 9.52 | 9.79 | 9.86 | 9.86 | 9.92 | 10 | 10.1 | 10.1 | 10.1 |