| Start Page |
|
 |
| Start Page |
|
|
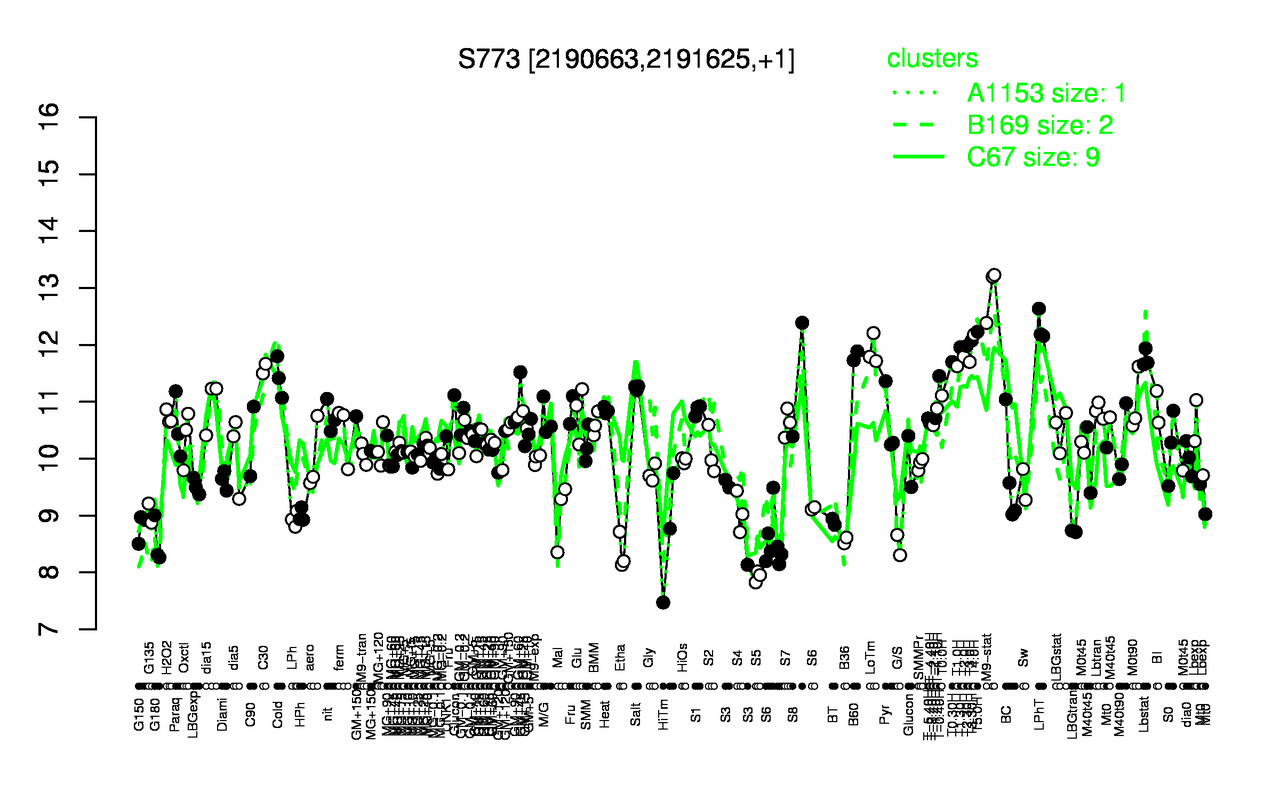
| M9-stat | LPhT | T5.0H | T4.0H | T3.30H | T2.30H | T1.30H | LoTm | B60 | T2.0H |
| 12.9 | 12.3 | 12.2 | 12.2 | 12.1 | 12 | 12 | 11.9 | 11.8 | 11.8 |
| S5 | Etha | G/S | G180 | B36 | S6 | HiTm | LBGtran | G150 | BT |
| 7.93 | 8.35 | 8.48 | 8.53 | 8.56 | 8.66 | 8.66 | 8.72 | 8.8 | 8.89 |