| Start Page |
|
 |
| Start Page |
|
|
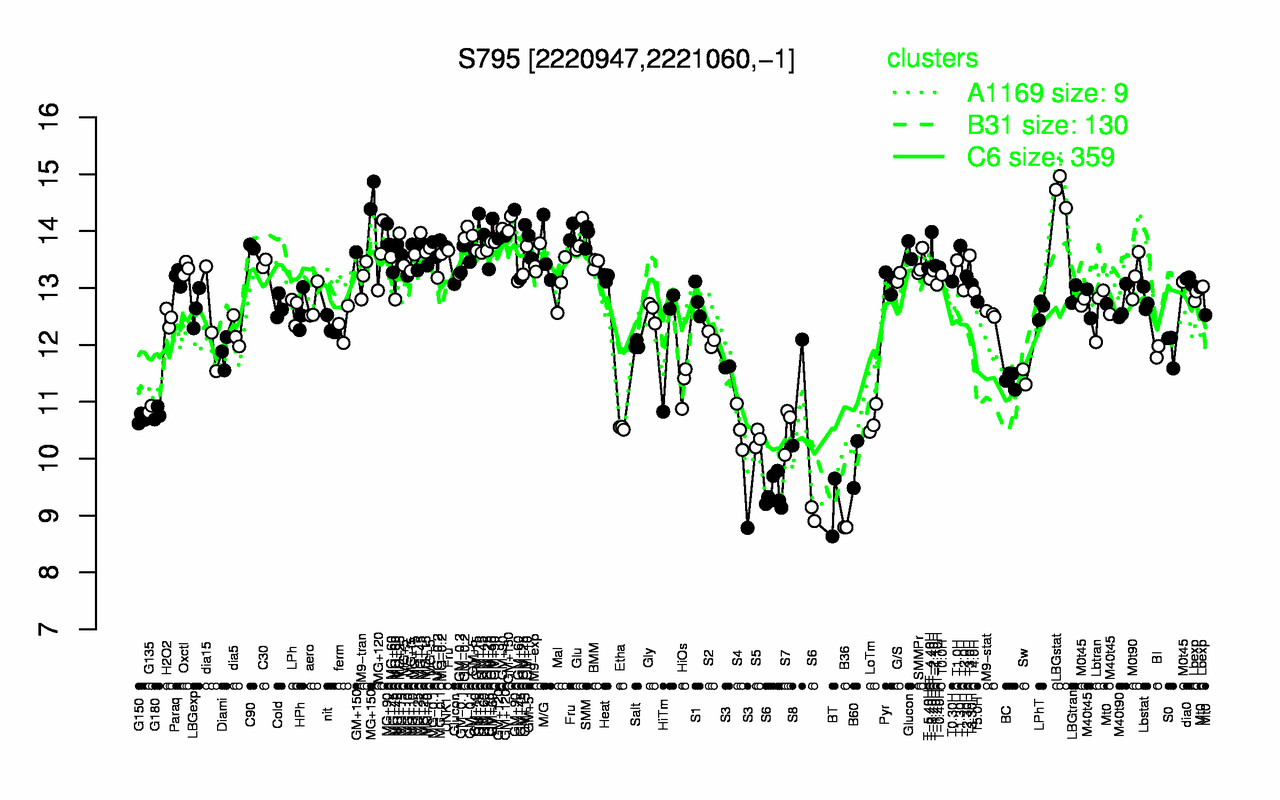
| LBGstat | MG+150 | GM+90 | T-3.40H | GM+150 | MG+90 | SMM | GM+120 | Fru | Glu |
| 14.7 | 14.6 | 14.1 | 14 | 14 | 13.9 | 13.9 | 13.9 | 13.9 | 13.9 |
| B36 | BT | S6 | B60 | S5 | Etha | S4 | S7 | S3 | LoTm |
| 8.79 | 9.14 | 9.3 | 9.9 | 10.4 | 10.5 | 10.5 | 10.5 | 10.7 | 10.7 |