| Start Page |
|
 |
| Start Page |
|
|
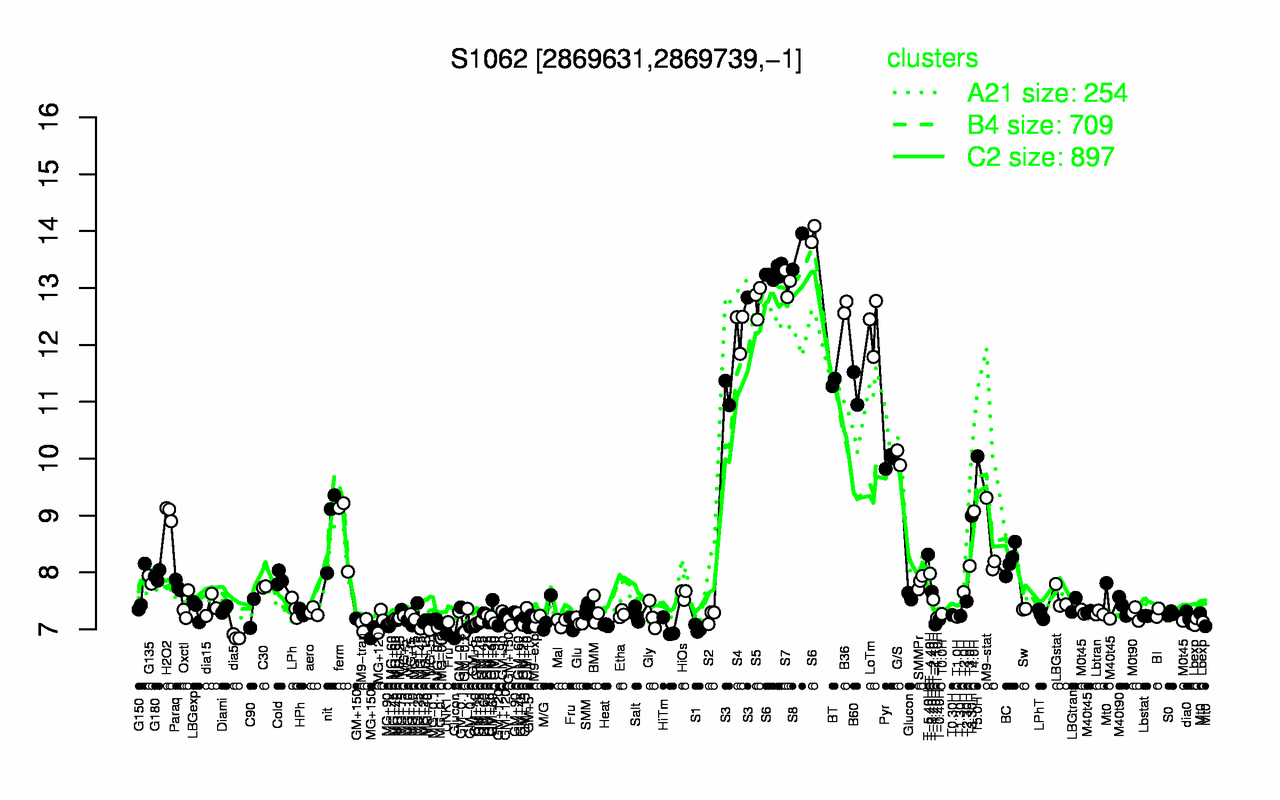
| S8 | S6 | S7 | S5 | B36 | LoTm | S4 | S3 | BT | B60 |
| 13.6 | 13.4 | 13.1 | 12.8 | 12.7 | 12.3 | 12.3 | 11.7 | 11.3 | 11.2 |
| dia5 | UNK1 | MG-0.2 | MG+150 | S1 | HiTm | MG+90 | Heat | T-1.40H | M9-tran |
| 6.87 | 6.91 | 6.94 | 6.94 | 7.01 | 7.02 | 7.06 | 7.07 | 7.09 | 7.09 |