B. subtilis Expression Data Browser
Start Page
B. subtilis Expression Data Browser
Gene/Segment:
S85
Locus Tag:
new_238571_238643_c
Details about S85
Show/Hide
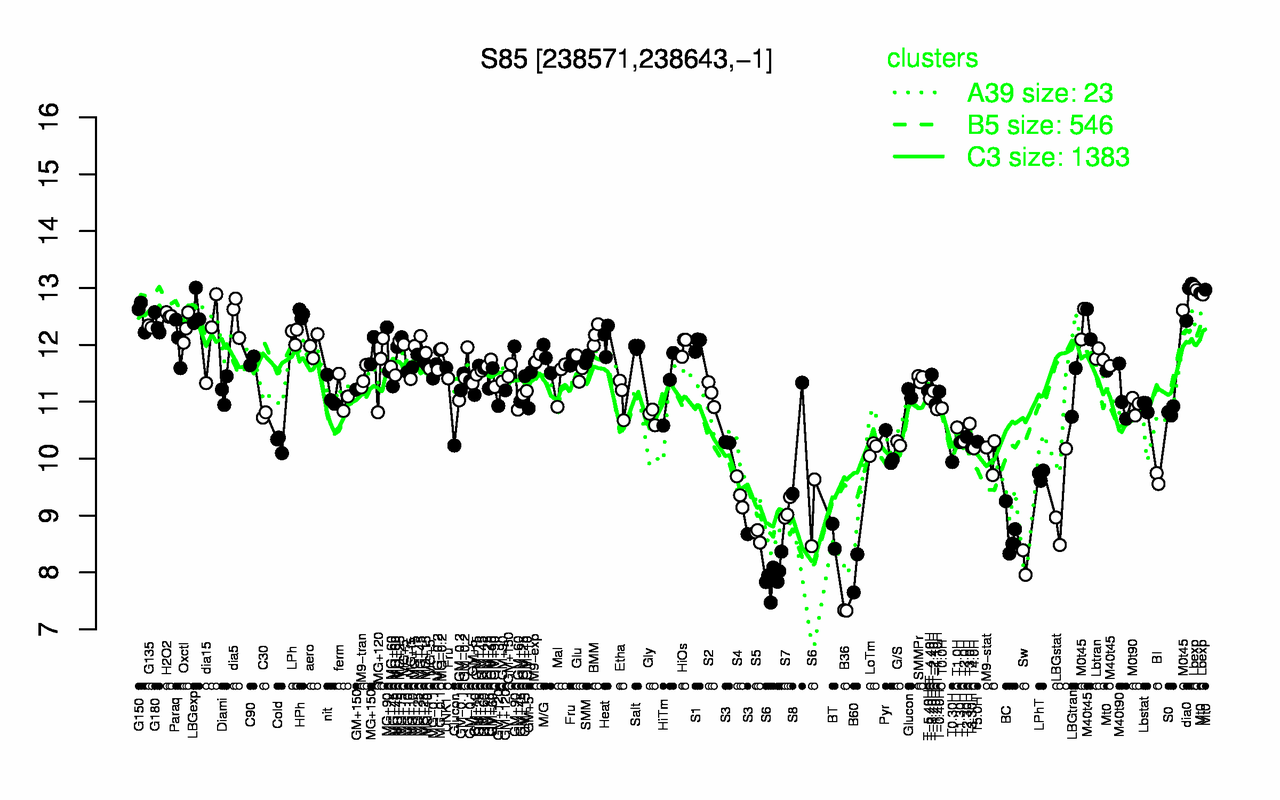
Highest Expression Conditions
Lbexp
dia0
LBGexp
HPh
G150
H2O2
dia5
Mt0
M0t45
G180
13
12.8
12.6
12.5
12.5
12.5
12.5
12.5
12.4
12.4
Lowest Expression Conditions
B36
B60
Sw
S6
BT
S5
BC
S7
LBGstat
S4
7.33
7.98
8.17
8.18
8.64
8.66
8.71
9.1
9.21
9.4
Most Positively Correlated Segments
ybfF
S298
yrdC
yhcH
S955
yncF
S176
sipU
S756
yvrH
0.96
0.89
0.89
0.86
0.86
0.86
0.86
0.86
0.85
0.85
Most Negatively Correlated Segments
yknV
yknU
ybfJ
mpr
S738
yoyB
yycO
S458
yesJ
yocN
-0.83
-0.81
-0.79
-0.78
-0.77
-0.77
-0.75
-0.75
-0.75
-0.75
Expression Profile of Segment S85
Show/Hide
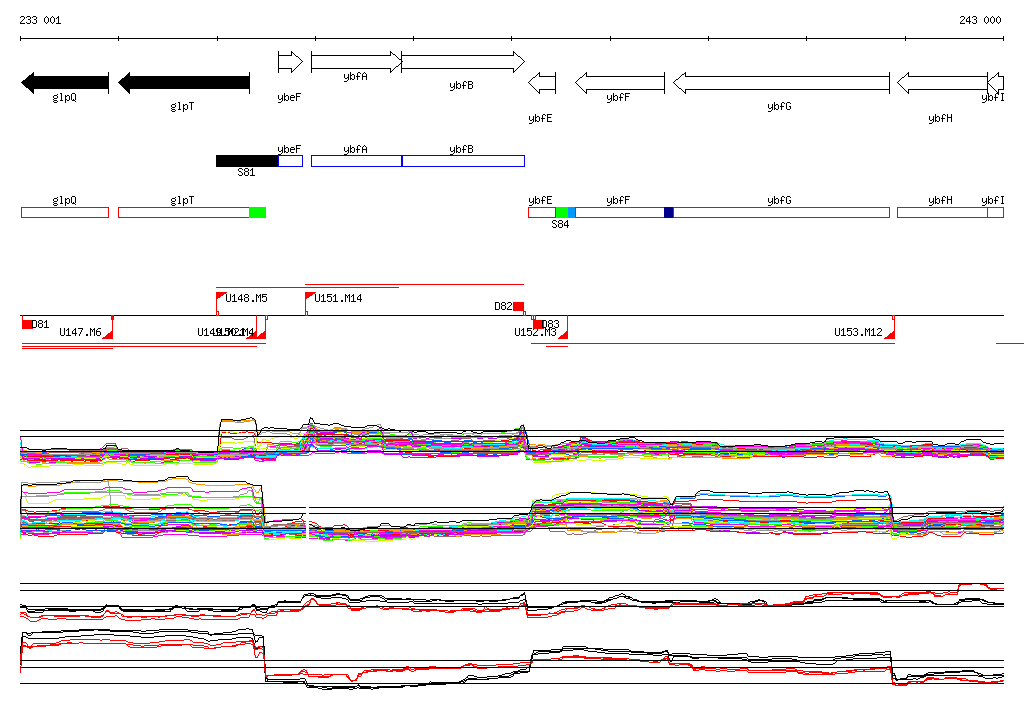
Genomic View of Gene/Segment S85
Show/Hide
(Legend)
Browse Genome Context