B. subtilis Expression Data Browser
Start Page
B. subtilis Expression Data Browser
Gene/Segment:
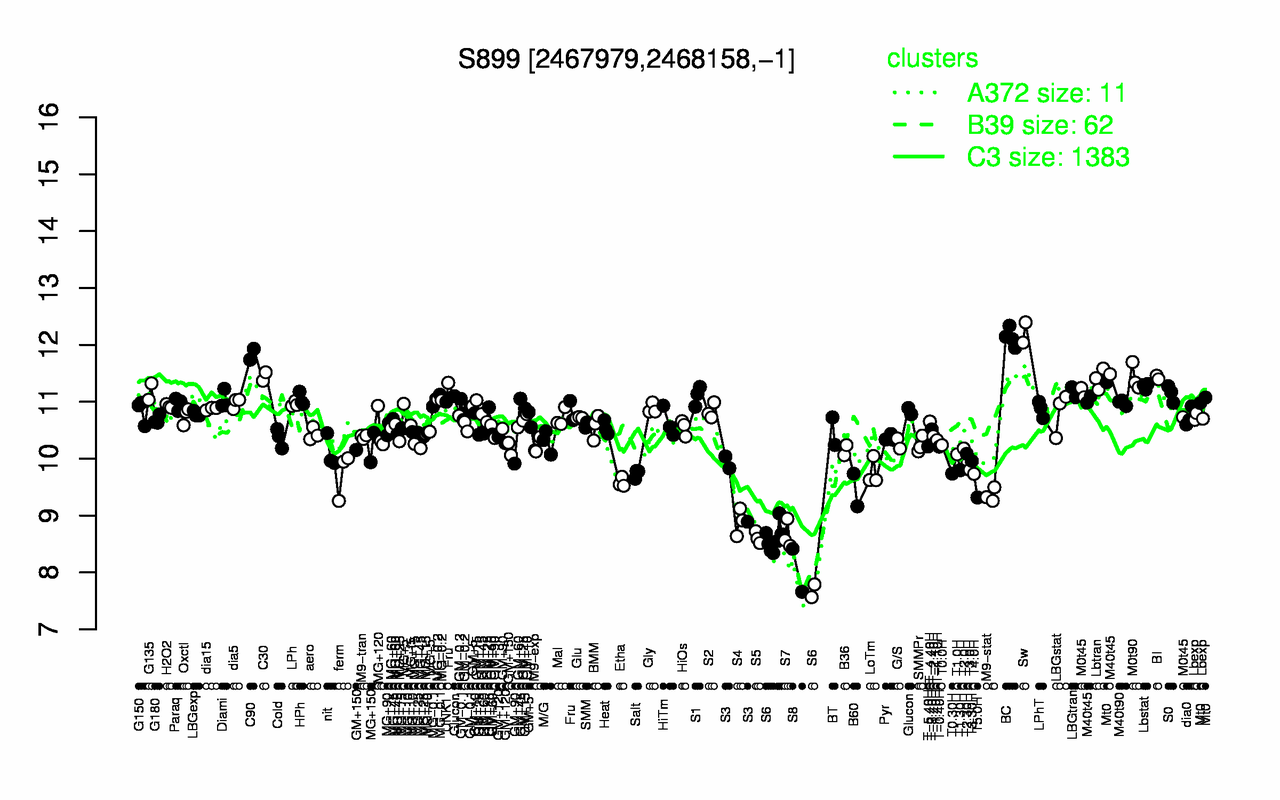
S899
Locus Tag:
new_2467979_2468158_c
Details about S899
Show/Hide
Highest Expression Conditions
Sw
BC
C90
C30
M0t90
BI
Lbtran
Lbstat
M40t45
G135
12.2
12.1
11.8
11.4
11.4
11.4
11.4
11.3
11.2
11.2
Lowest Expression Conditions
S8
S6
S5
S7
S4
T5.0H
M9-stat
B60
Etha
S3
8.04
8.39
8.61
8.66
8.89
9.32
9.36
9.45
9.58
9.59
Most Positively Correlated Segments
yqjT
yuxK
yfmR
coaA
rnjB
ydgF
moaE
bmrA
moaD
pbpD
0.97
0.92
0.86
0.85
0.85
0.85
0.84
0.84
0.84
0.84
Most Negatively Correlated Segments
S372
S650
yhfW
gpr
yoaQ
yndD
glnM
S478
glnP
yozP
-0.8
-0.8
-0.8
-0.8
-0.8
-0.8
-0.79
-0.79
-0.79
-0.79
Expression Profile of Segment S899
Show/Hide
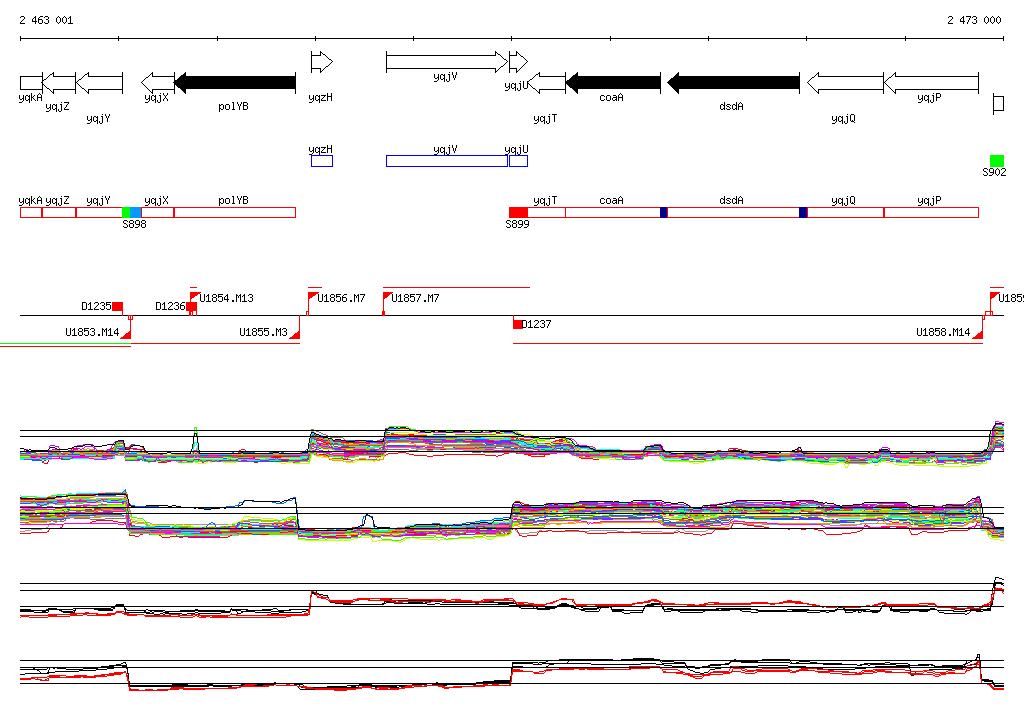
Genomic View of Gene/Segment S899
Show/Hide
(Legend)
Browse Genome Context