| Start Page |
|
 |
| Start Page |
|
|
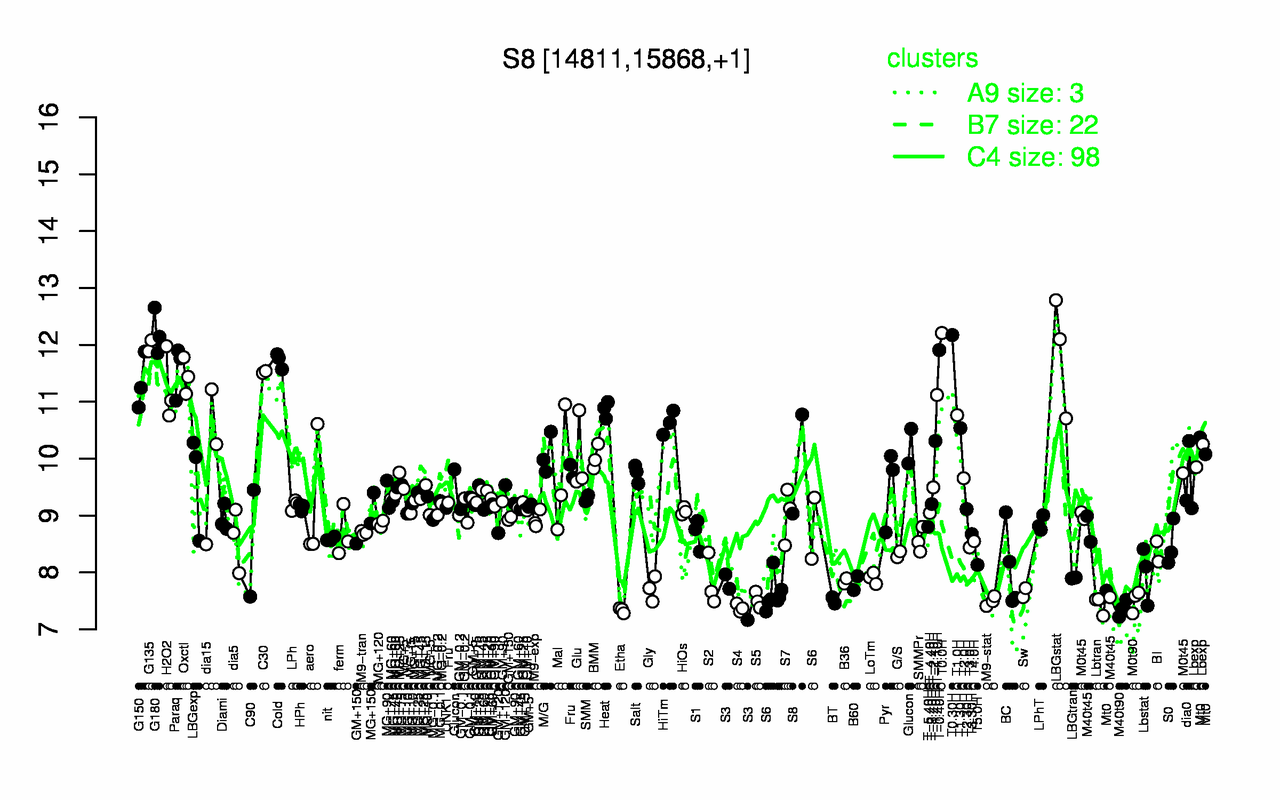
| G180 | T0.0H | T0.30H | G135 | T-0.40H | LBGstat | Cold | Paraq | C30 | Oxctl |
| 12.2 | 12.2 | 12.2 | 12 | 11.9 | 11.9 | 11.7 | 11.6 | 11.5 | 11.5 |
| Etha | M40t90 | S4 | Lbtran | M9-stat | M0t90 | BT | S5 | S3 | Sw |
| 7.33 | 7.37 | 7.38 | 7.43 | 7.5 | 7.51 | 7.51 | 7.51 | 7.61 | 7.64 |