| Start Page |
|
 |
| Start Page |
|
|
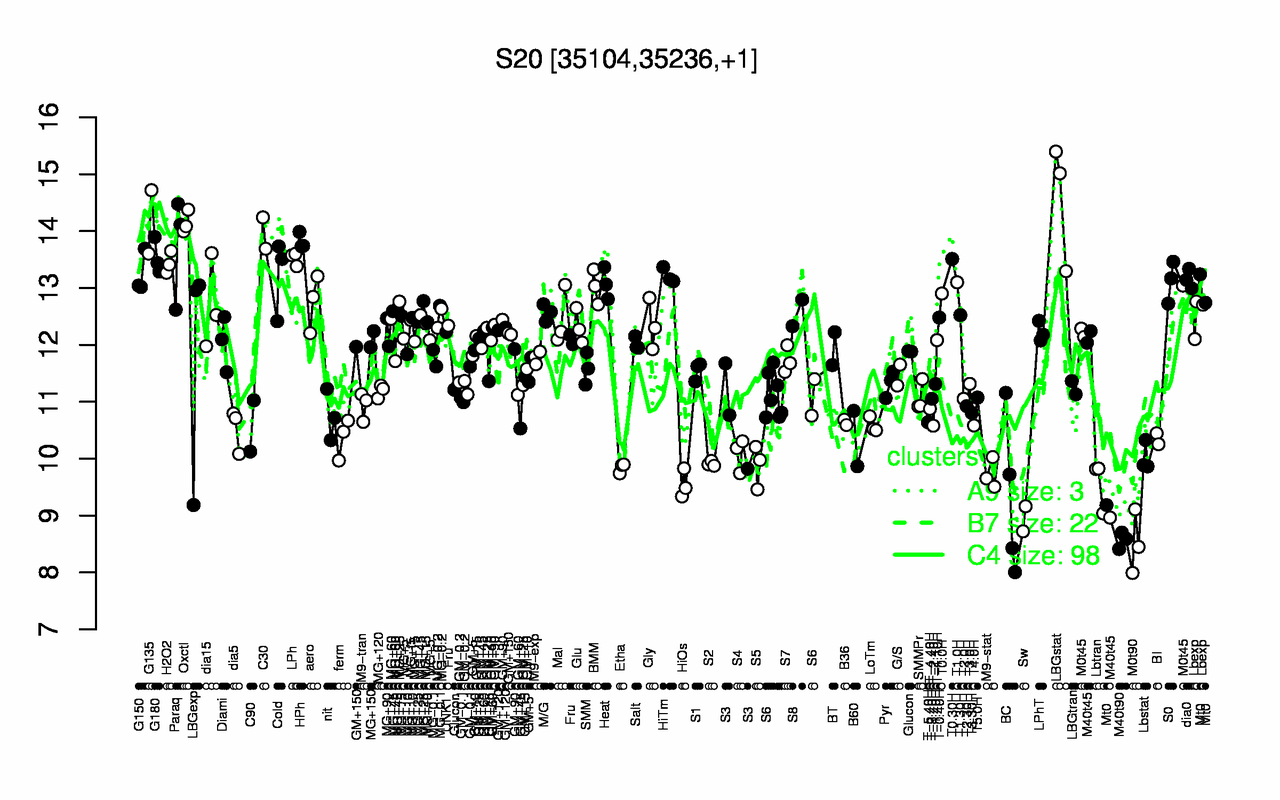
| LBGstat | G135 | Oxctl | C30 | HPh | Paraq | G180 | LPh | T0.30H | H2O2 |
| 14.6 | 14.2 | 14.2 | 14 | 13.8 | 13.7 | 13.5 | 13.5 | 13.5 | 13.4 |
| M0t90 | M40t90 | Sw | BC | HiOs | Lbtran | M9-stat | Etha | S5 | S2 |
| 8.52 | 8.57 | 8.94 | 9.33 | 9.55 | 9.56 | 9.73 | 9.84 | 9.88 | 9.91 |