B. subtilis Expression Data Browser
Start Page
B. subtilis Expression Data Browser
Gene/Segment:
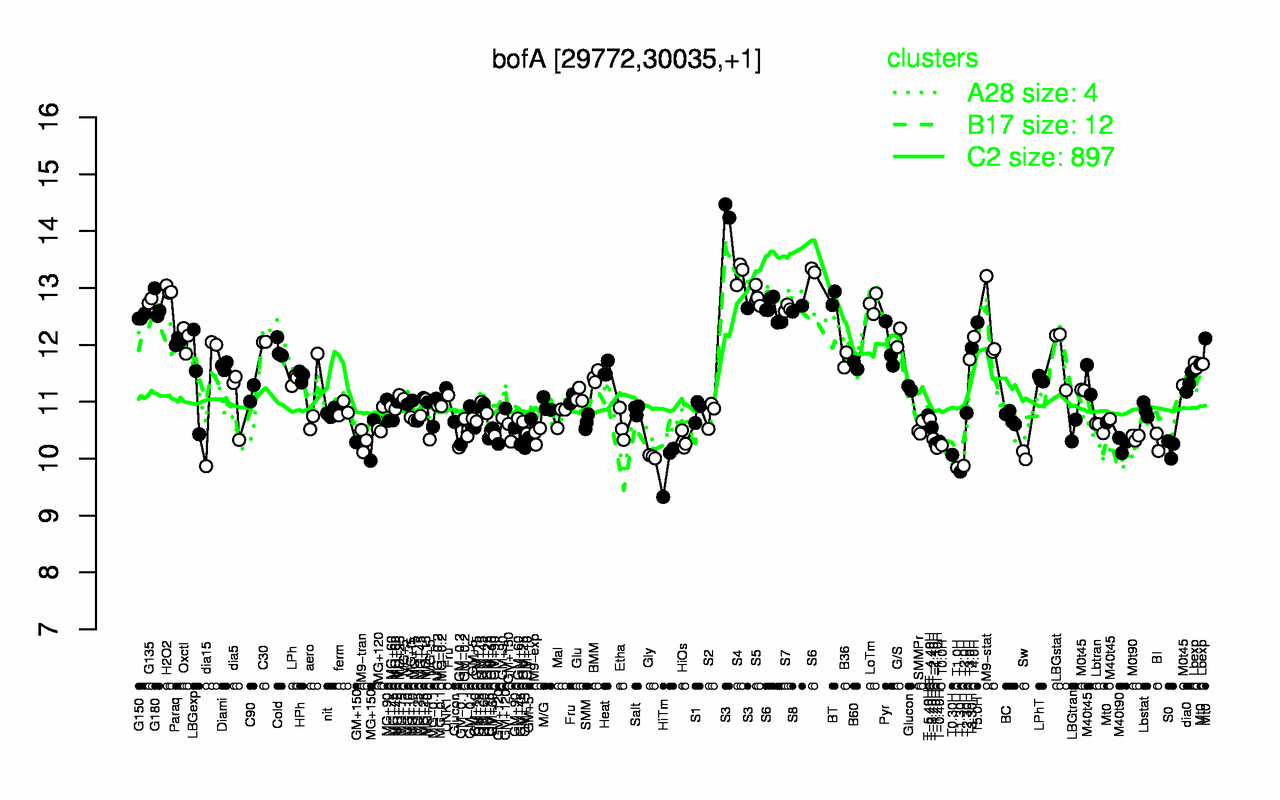
bofA
Locus Tag:
BSU00230
Details about bofA
Show/Hide
Highest Expression Conditions
S3
S4
H2O2
S5
BT
G135
S6
LoTm
G180
S7
13.8
13.3
13
12.9
12.8
12.8
12.7
12.7
12.7
12.6
Lowest Expression Conditions
T1.30H
T1.0H
HiTm
T2.0H
Gly
Sw
T0.30H
T-1.10H
S0
T0.0H
9.77
9.84
9.87
9.87
10
10.1
10.1
10.2
10.2
10.2
Most Positively Correlated Segments
S837
yptA
S662
dacB
spoIVFB
spmB
yunB
spmA
ytxC
spoIVFA
0.87
0.86
0.85
0.83
0.83
0.83
0.83
0.82
0.81
0.81
Most Negatively Correlated Segments
pksB
yvbK
ydbB
yydB
yraN
sigD
yceH
mdh
ydbC
ymaE
-0.71
-0.69
-0.67
-0.67
-0.67
-0.67
-0.66
-0.66
-0.66
-0.66
Expression Profile of Segment bofA
Show/Hide
Annotation of Gene bofA
Show/Hide
function
16.3: Control
inference
ab initio prediction:AMIGene:2.0
codon_start
1
product
inhibitor of the pro-sigma(K) processing machinery
transl_table
11
note
Evidence 1a: Function experimentally demonstrated in the studied strain; PubMedId: 15087499; Product type r: regulator
db_xref
GI:225184643
protein_id
CAB11799.2
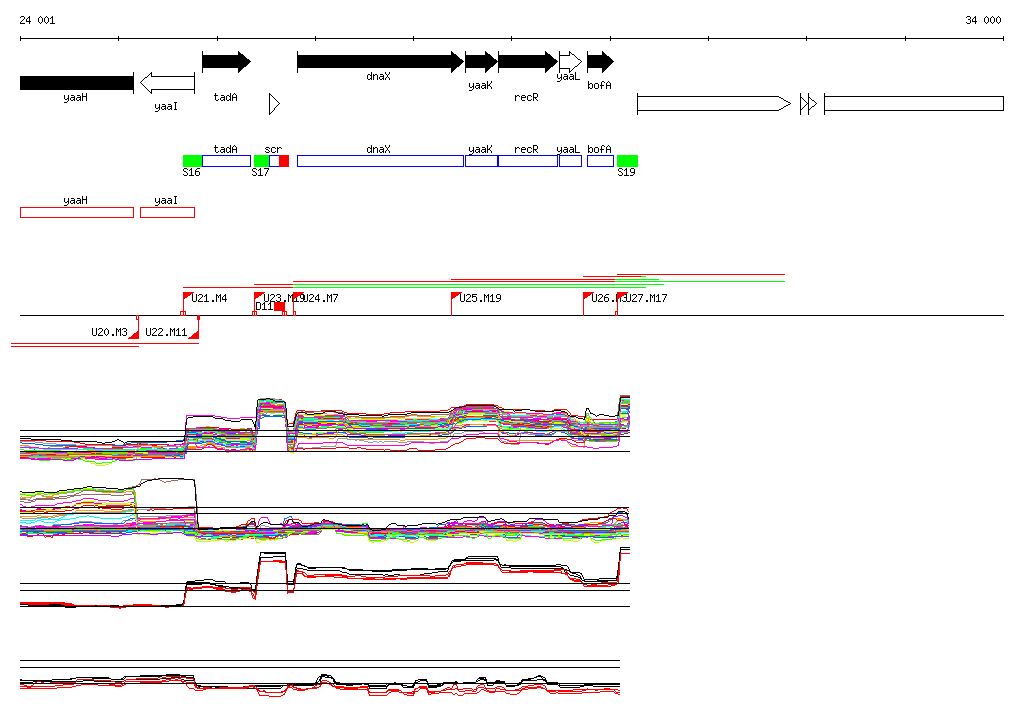
Genomic View of Gene/Segment bofA
Show/Hide
(Legend)
Browse Genome Context