| Start Page |
|
 |
| Start Page |
|
|
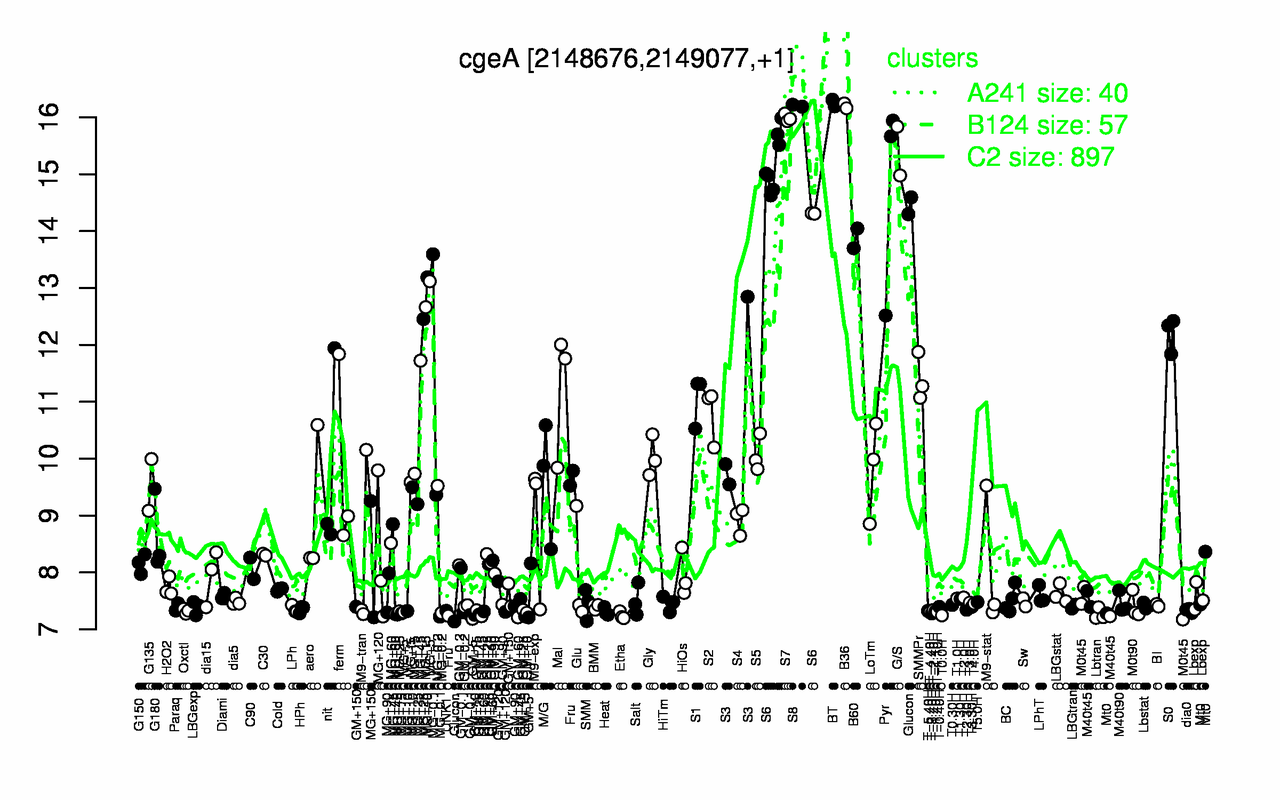
| BT | S8 | B36 | S7 | G/S | S6 | Pyr | B60 | S0 | Glucon |
| 16.3 | 16.2 | 16.2 | 16 | 15.4 | 15 | 14.7 | 13.9 | 12.2 | 12 |
| Etha | T0.0H | Lbtran | GM+10 | T-3.40H | T-4.40H | T-1.10H | Heat | T-1.40H | Oxctl |
| 7.24 | 7.25 | 7.27 | 7.27 | 7.28 | 7.3 | 7.31 | 7.31 | 7.32 | 7.32 |