| Start Page |
|
 |
| Start Page |
|
|
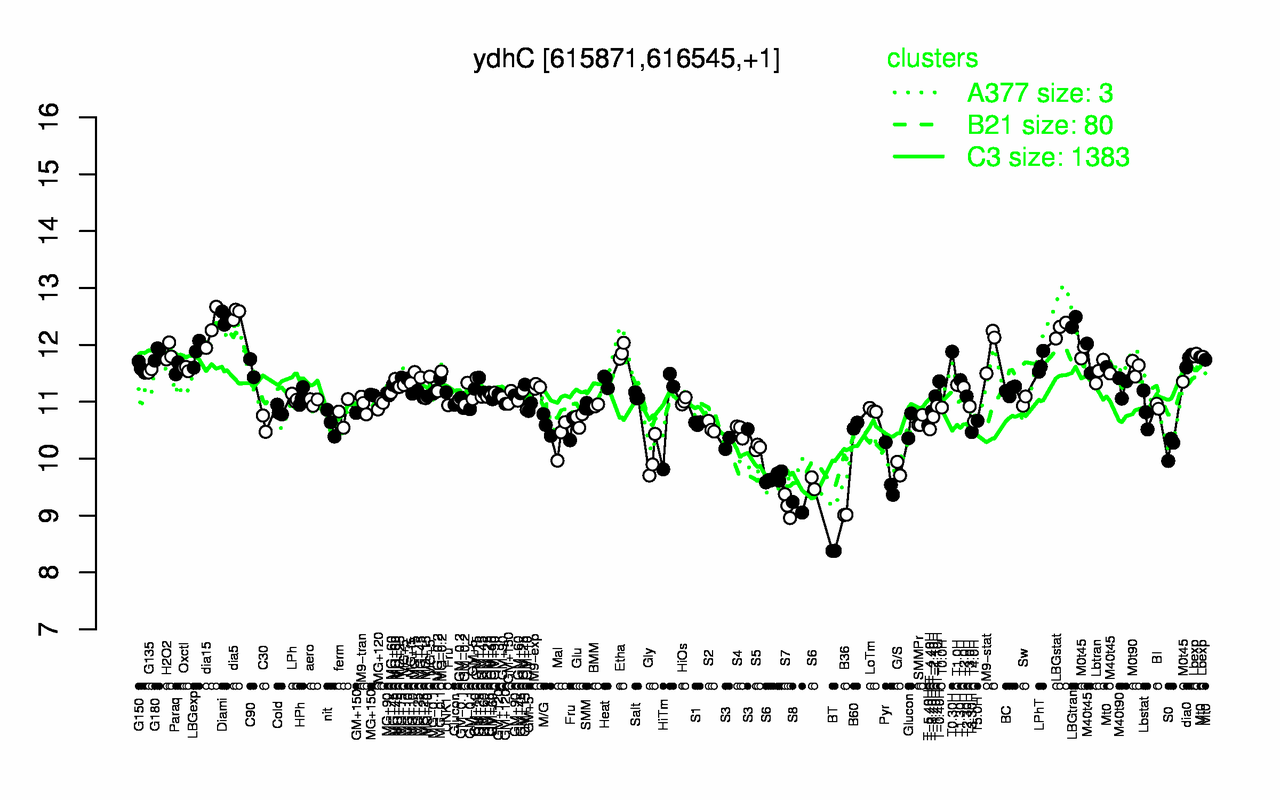
| dia5 | Diami | LBGtran | dia15 | LBGstat | M9-stat | T0.30H | Etha | H2O2 | G180 |
| 12.5 | 12.5 | 12.4 | 12.3 | 12.3 | 12 | 11.9 | 11.9 | 11.9 | 11.9 |
| BT | B36 | S8 | S7 | S6 | Pyr | G/S | Gly | S0 | S5 |
| 8.38 | 9.01 | 9.15 | 9.17 | 9.64 | 9.73 | 9.82 | 10 | 10.2 | 10.2 |