B. subtilis Expression Data Browser
Start Page
B. subtilis Expression Data Browser
Gene/Segment:
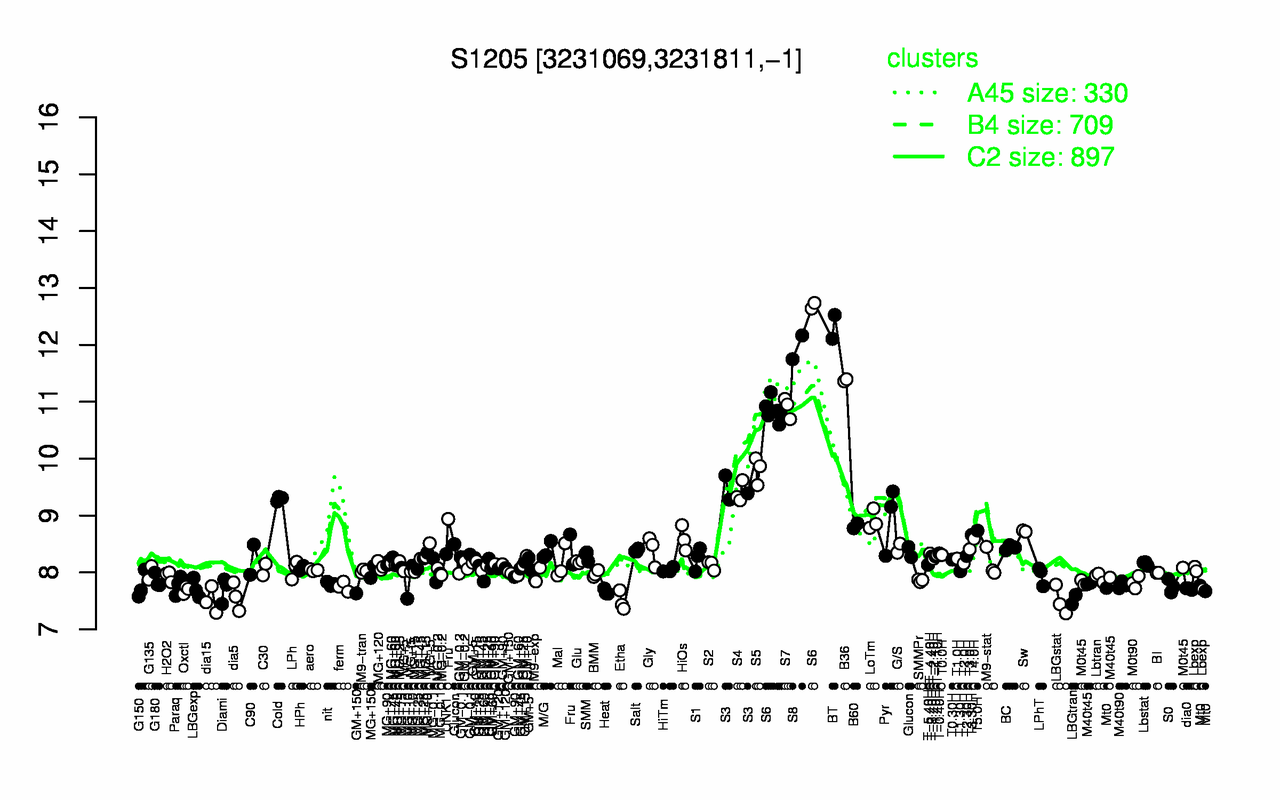
S1205
Locus Tag:
new_3231069_3231811_c
Details about S1205
Show/Hide
Highest Expression Conditions
BT
S8
B36
S6
S7
S5
S3
S4
Cold
Pyr
12.3
12
11.4
11.2
10.9
9.8
9.46
9.41
9.29
8.96
Lowest Expression Conditions
Etha
LBGstat
dia15
LBGtran
dia5
Heat
Oxctl
Diami
dia0
LBGexp
7.49
7.5
7.51
7.52
7.57
7.66
7.69
7.7
7.71
7.72
Most Positively Correlated Segments
kapD
fadM
S1206
S1264
S1083
S477
S1266
S1317
cotR
yppG
0.96
0.89
0.89
0.89
0.88
0.88
0.88
0.88
0.88
0.88
Most Negatively Correlated Segments
yvcP
prsA
moeB
lytG
S552
S1439
parA
S847
yvrH
dnaB
-0.83
-0.83
-0.82
-0.82
-0.82
-0.82
-0.82
-0.82
-0.82
-0.82
Expression Profile of Segment S1205
Show/Hide
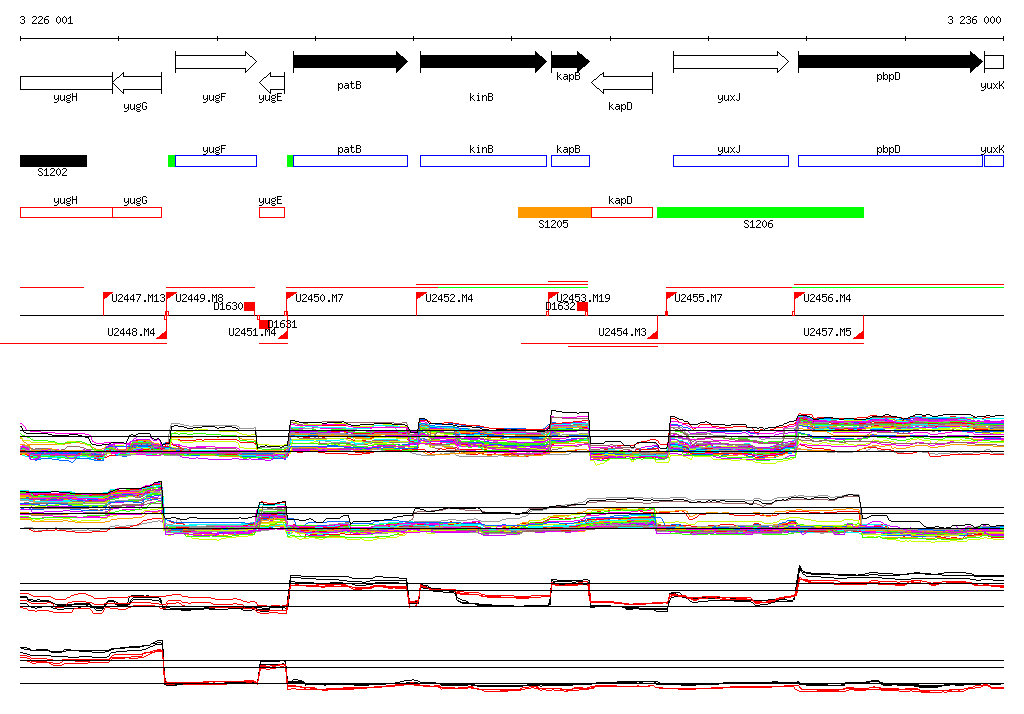
Genomic View of Gene/Segment S1205
Show/Hide
(Legend)
Browse Genome Context