| Start Page |
|
 |
| Start Page |
|
|
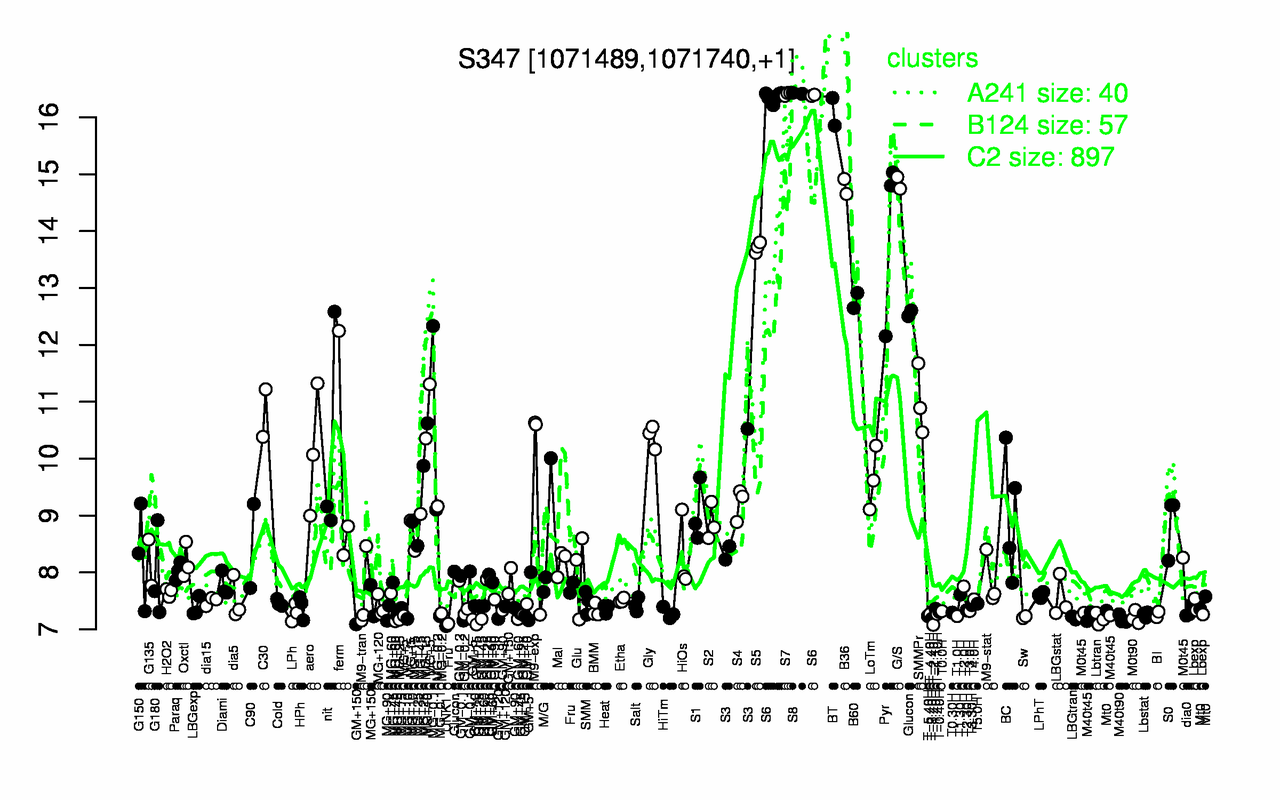
| S8 | S7 | S6 | BT | G/S | B36 | Pyr | S5 | B60 | Glucon |
| 16.4 | 16.4 | 16.4 | 16.1 | 14.8 | 14.8 | 14 | 13.7 | 12.8 | 11 |
| UNK1 | T-2.40H | M40t90 | Lbtran | T-3.40H | LBGtran | M0t90 | Sw | M40t45 | T1.0H |
| 7.06 | 7.08 | 7.18 | 7.18 | 7.19 | 7.2 | 7.21 | 7.21 | 7.23 | 7.23 |