| Start Page |
|
 |
| Start Page |
|
|
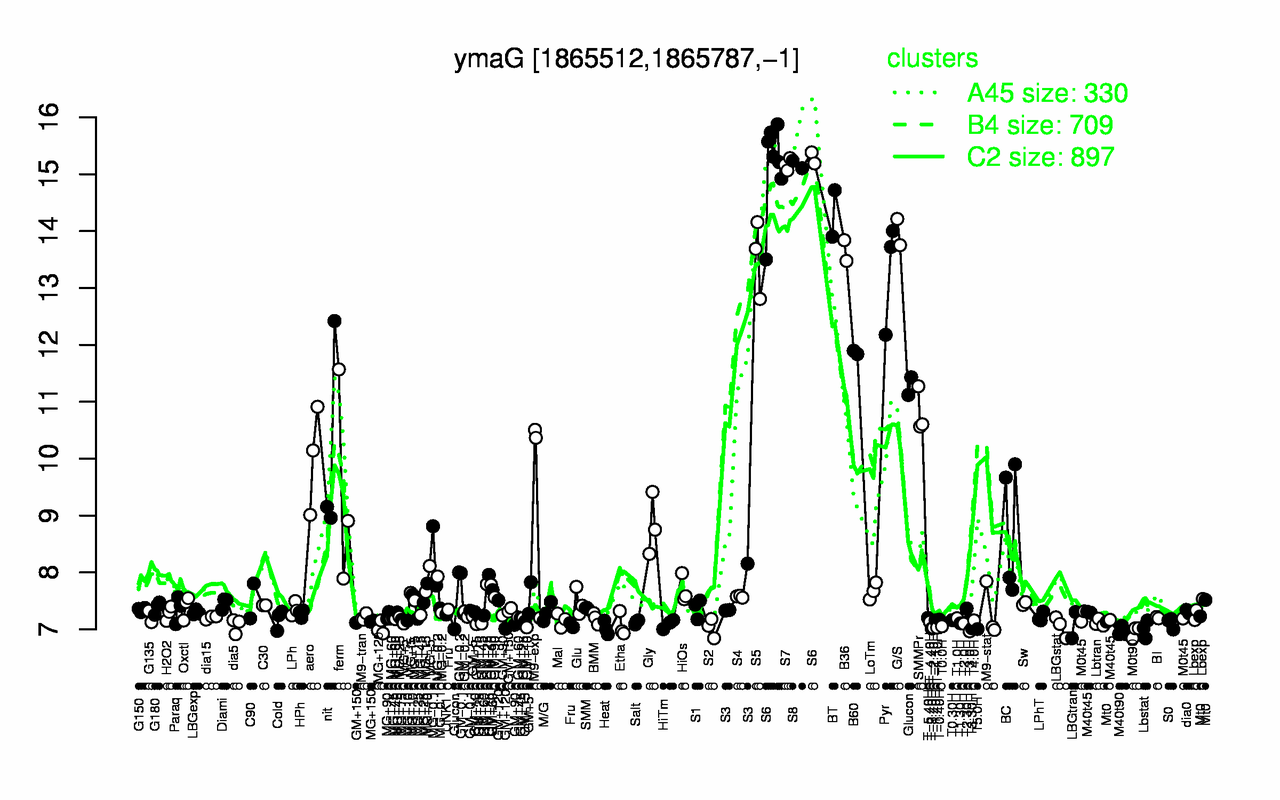
| S6 | S8 | S7 | BT | G/S | B36 | S5 | Pyr | B60 | SMMPr |
| 15.2 | 15.2 | 15.2 | 14.3 | 14 | 13.7 | 13.6 | 13.3 | 11.9 | 10.8 |
| M0t90 | M40t90 | T3.0H | T5.0H | Lbstat | T3.30H | T-3.40H | MG+120 | Heat | T-2.40H |
| 6.96 | 6.96 | 6.97 | 7.01 | 7.01 | 7.02 | 7.02 | 7.02 | 7.02 | 7.03 |