B. subtilis Expression Data Browser
Start Page
B. subtilis Expression Data Browser
Gene/Segment:
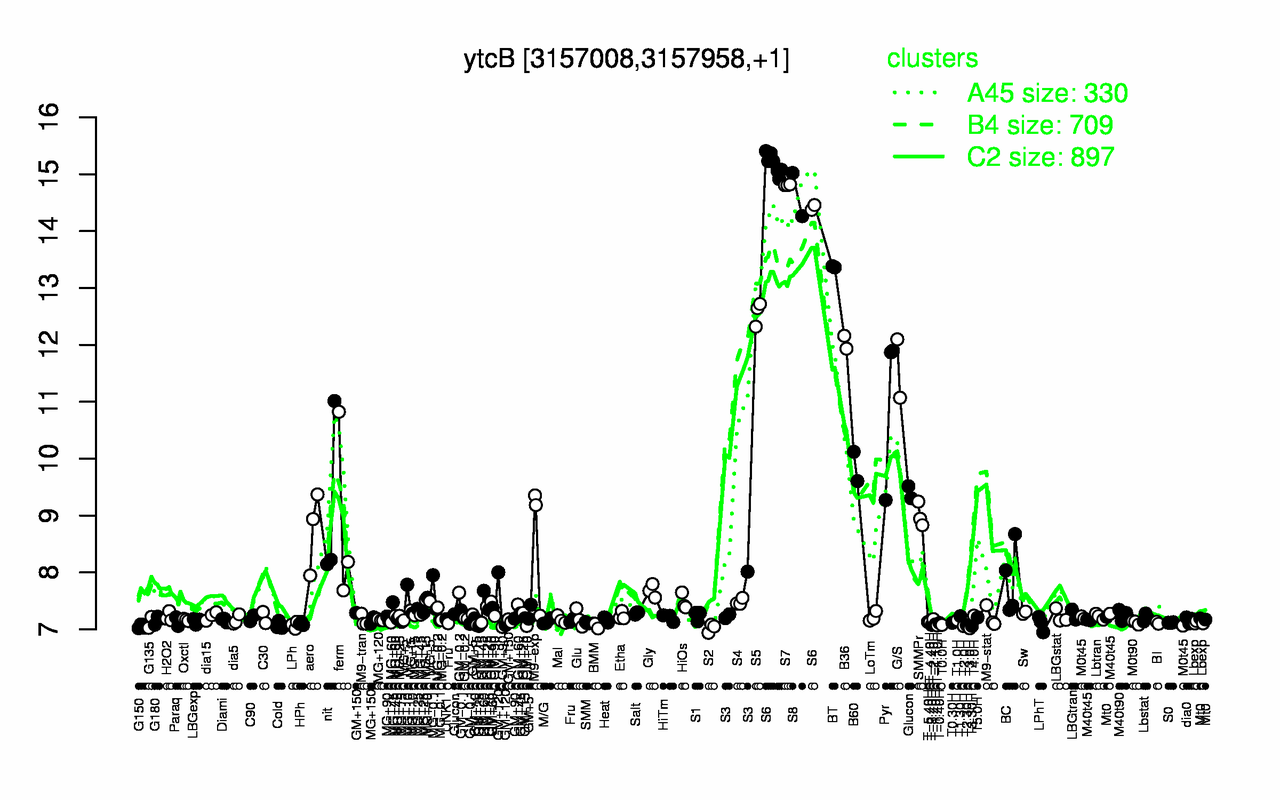
ytcB
Locus Tag:
BSU30870
Details about ytcB
Show/Hide
Highest Expression Conditions
S6
S7
S8
BT
S5
B36
G/S
Pyr
B60
nit
15
14.8
14.6
13.4
12.6
12
11.6
11
9.86
9.13
Lowest Expression Conditions
T3.0H
S2
G150
T3.30H
T2.0H
T-1.10H
Cold
BMM
T2.30H
LPh
7.02
7.02
7.04
7.06
7.06
7.07
7.07
7.07
7.07
7.08
Most Positively Correlated Segments
ytcC
ytcA
yitB
yisZ
yitD
yitC
S394
ydgA
gerT
yitA
1
1
0.99
0.99
0.99
0.99
0.99
0.99
0.99
0.99
Most Negatively Correlated Segments
bceR
S1189
ykuH
S1355
bceS
yeaC
S511
ptkA
parA
pbpD
-0.82
-0.82
-0.82
-0.81
-0.81
-0.81
-0.81
-0.8
-0.8
-0.8
Expression Profile of Segment ytcB
Show/Hide
Annotation of Gene ytcB
Show/Hide
function
16.11: Scavenge (Catabolism)
inference
ab initio prediction:AMIGene:2.0
codon_start
1
EC_number
5.1.3.2
transl_table
11
note
Evidence 3: Function proposed based on presence of conserved amino acid motif, structural feature or limited homology; Product type pe: putative enzyme
db_xref
GI:2635571
product
putative UDP-glucose epimerase
protein_id
CAB15065.1
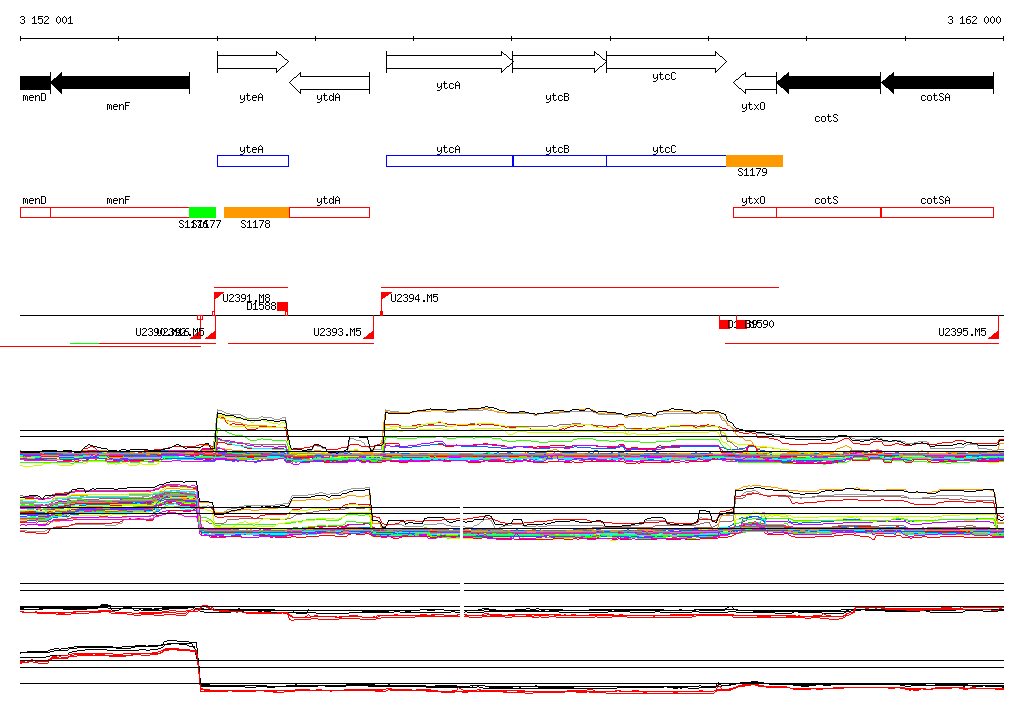
Genomic View of Gene/Segment ytcB
Show/Hide
(Legend)
Browse Genome Context