| Start Page |
|
 |
| Start Page |
|
|
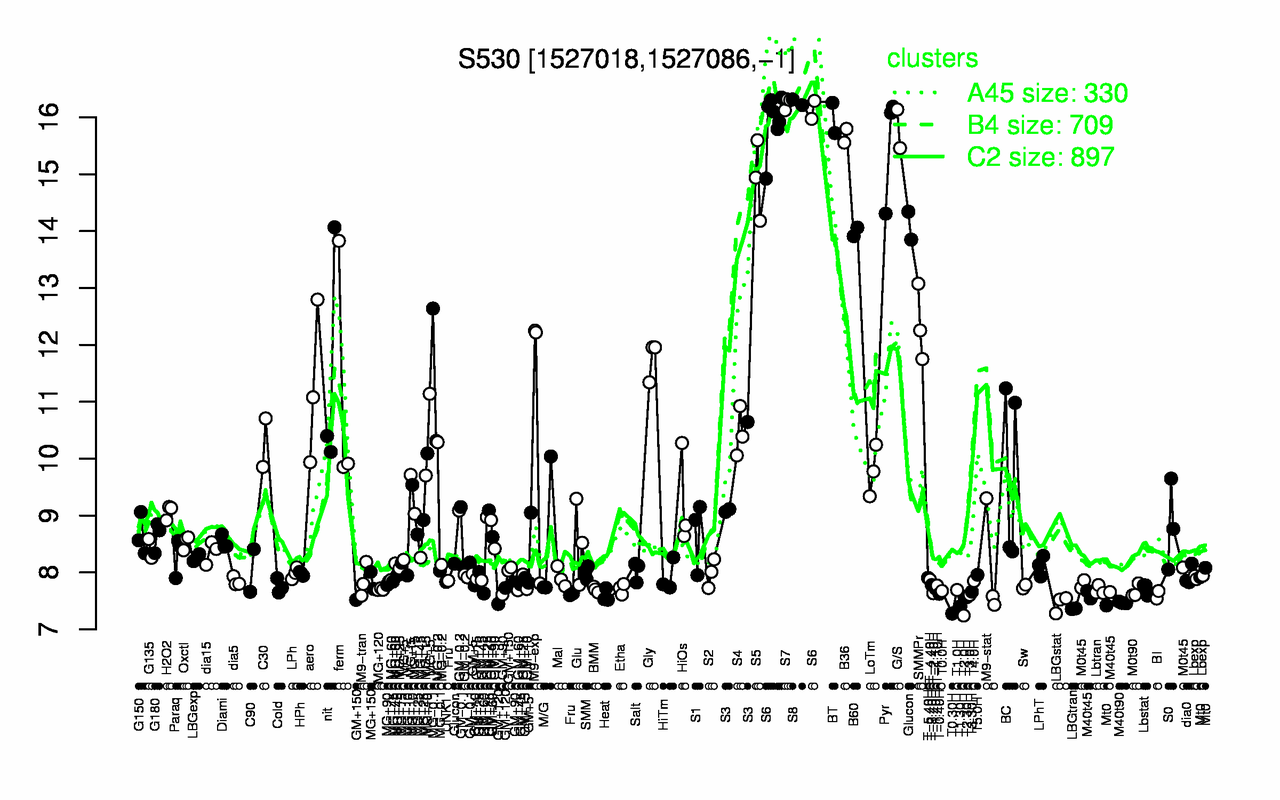
| S8 | S7 | BT | S6 | G/S | B36 | Pyr | S5 | B60 | SMMPr |
| 16.3 | 16.2 | 16 | 16 | 15.8 | 15.7 | 15.5 | 14.9 | 14 | 12.4 |
| T2.0H | T0.30H | LBGtran | T1.30H | LBGstat | M40t90 | T2.30H | GM+120 | Heat | T3.0H |
| 7.24 | 7.28 | 7.36 | 7.4 | 7.45 | 7.47 | 7.56 | 7.59 | 7.59 | 7.6 |