| Start Page |
|
 |
| Start Page |
|
|
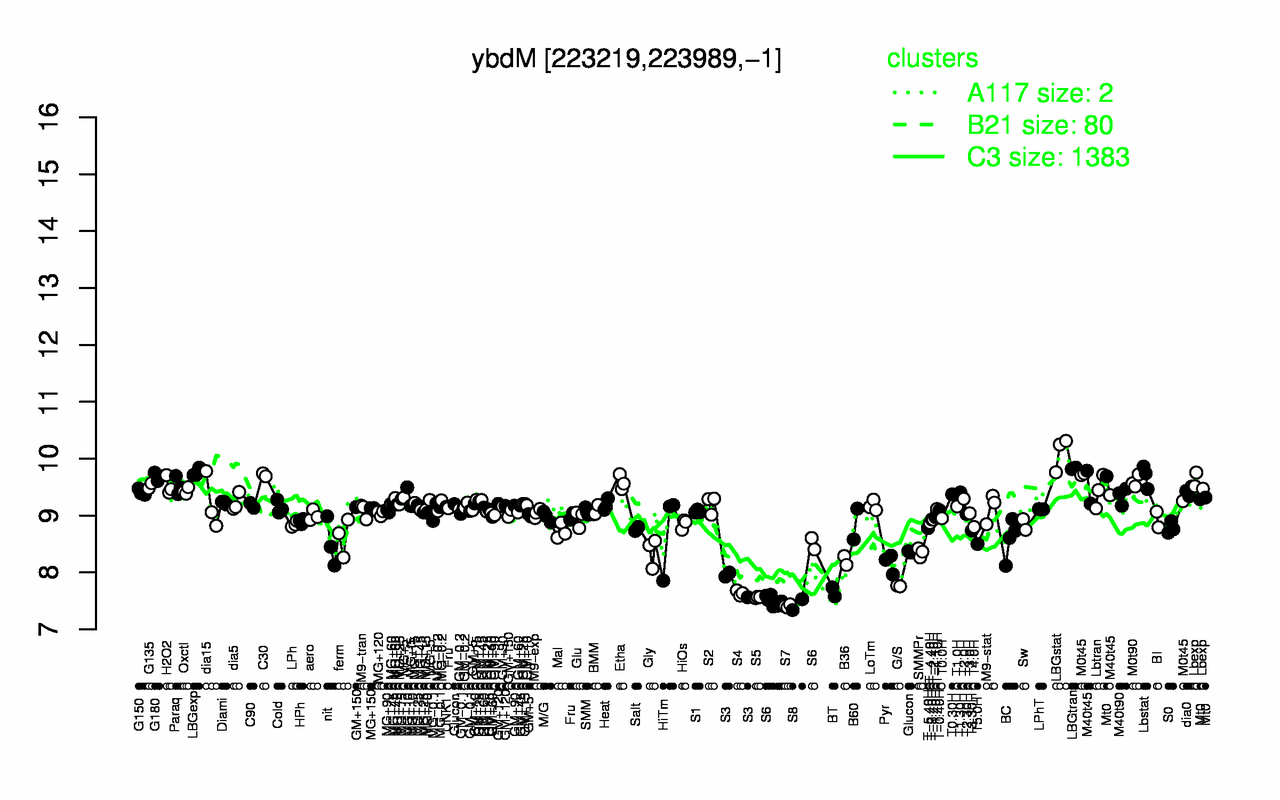
| LBGstat | LBGtran | LBGexp | C30 | Lbstat | G180 | M0t90 | Etha | Lbexp | M0t45 |
| 10.1 | 9.83 | 9.76 | 9.72 | 9.69 | 9.69 | 9.6 | 9.58 | 9.58 | 9.57 |
| S7 | S8 | S5 | S4 | BT | S6 | G/S | S3 | Pyr | B36 |
| 7.41 | 7.44 | 7.56 | 7.64 | 7.66 | 7.72 | 7.76 | 7.83 | 8.16 | 8.21 |