B. subtilis Expression Data Browser
Details about ctaB Show/Hide
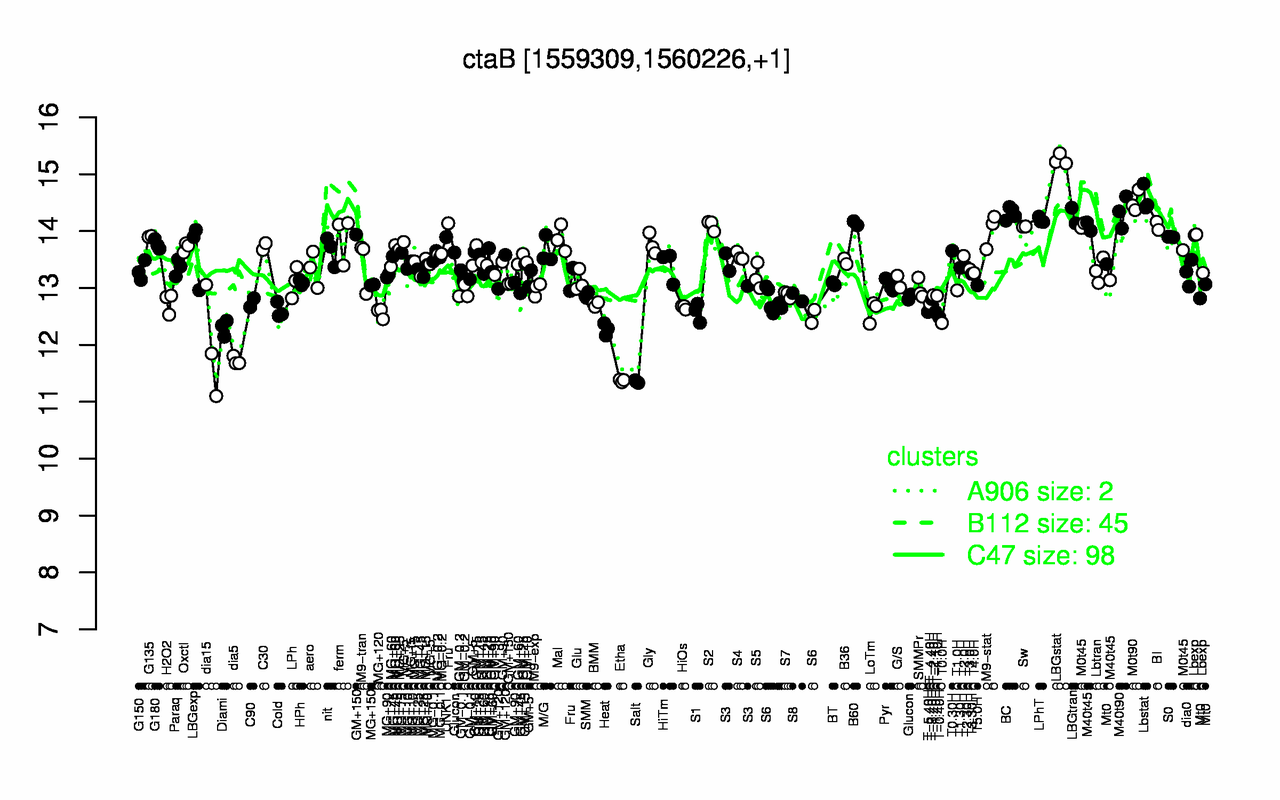
Highest Expression Conditions
LBGstat Lbstat M0t90 M40t90 BC LBGtran LPhT B60 S2 BI
15.3 14.6 14.5 14.3 14.3 14.3 14.2 14.1 14.1 14.1
Lowest Expression Conditions
Salt Etha dia5 dia15 Heat Diami T0.0H T-0.40H MG+120 S1
11.4 11.4 11.7 12 12.3 12.3 12.4 12.5 12.6 12.6
Most Positively Correlated Segments
S543 yfmQ ctaA S1422 resB S879 resC ydbL yozB bdbC
0.86 0.84 0.77 0.71 0.71 0.69 0.69 0.68 0.68 0.68
Most Negatively Correlated Segments
S1164 S1063 suhB S398 S716 ykhA yueE ykzC sapB ylbQ
-0.57 -0.55 -0.55 -0.52 -0.52 -0.52 -0.49 -0.49 -0.47 -0.46
Expression Profile of Segment ctaB Show/Hide
Annotation of Gene ctaB Show/Hide
function
16.10: Respire
function
16.6: Maintain
inference
ab initio prediction:AMIGene:2.0
codon_start
1
product
cytochrome caa3 oxydase assembly factor
transl_table
11
note
Evidence 1a: Function experimentally demonstrated in the studied strain; PubMedId: 10675592, 15849754, 16850406, 7968515, 9829923; Product type f: factor
db_xref
GI:2633859
protein_id
CAB13361.1
Genomic View of Gene/Segment ctaB Show/Hide
(Legend)