| Start Page |
|
 |
| Start Page |
|
|
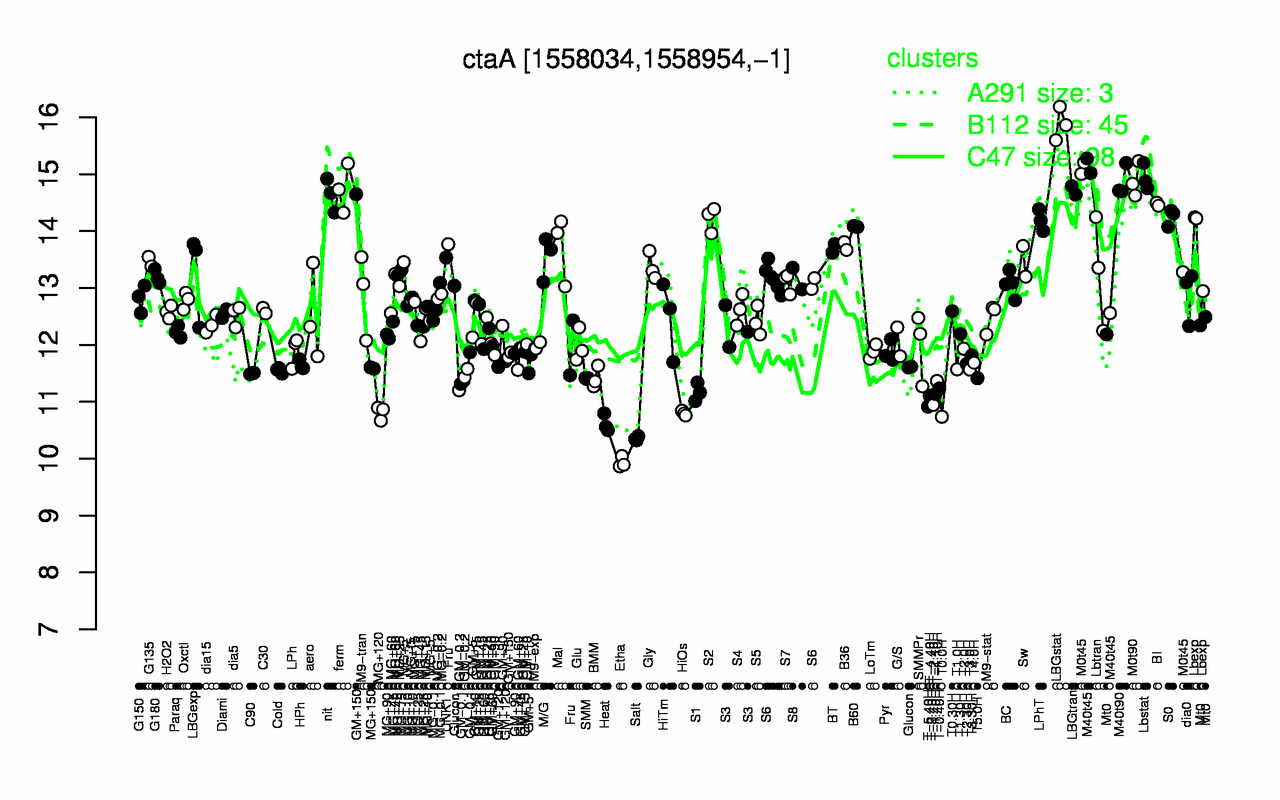
| LBGstat | Lbstat | M0t90 | M40t90 | ferm | LBGtran | nit | M0t45 | BI | M40t45 |
| 15.9 | 14.9 | 14.9 | 14.9 | 14.7 | 14.7 | 14.6 | 14.5 | 14.5 | 14.3 |
| Etha | Salt | Heat | T0.0H | HiOs | MG+120 | T-5.40H | T-2.40H | T-3.40H | T-4.40H |
| 9.93 | 10.4 | 10.6 | 10.7 | 10.8 | 10.8 | 10.9 | 10.9 | 11.1 | 11.1 |