| Start Page |
|
 |
| Start Page |
|
|
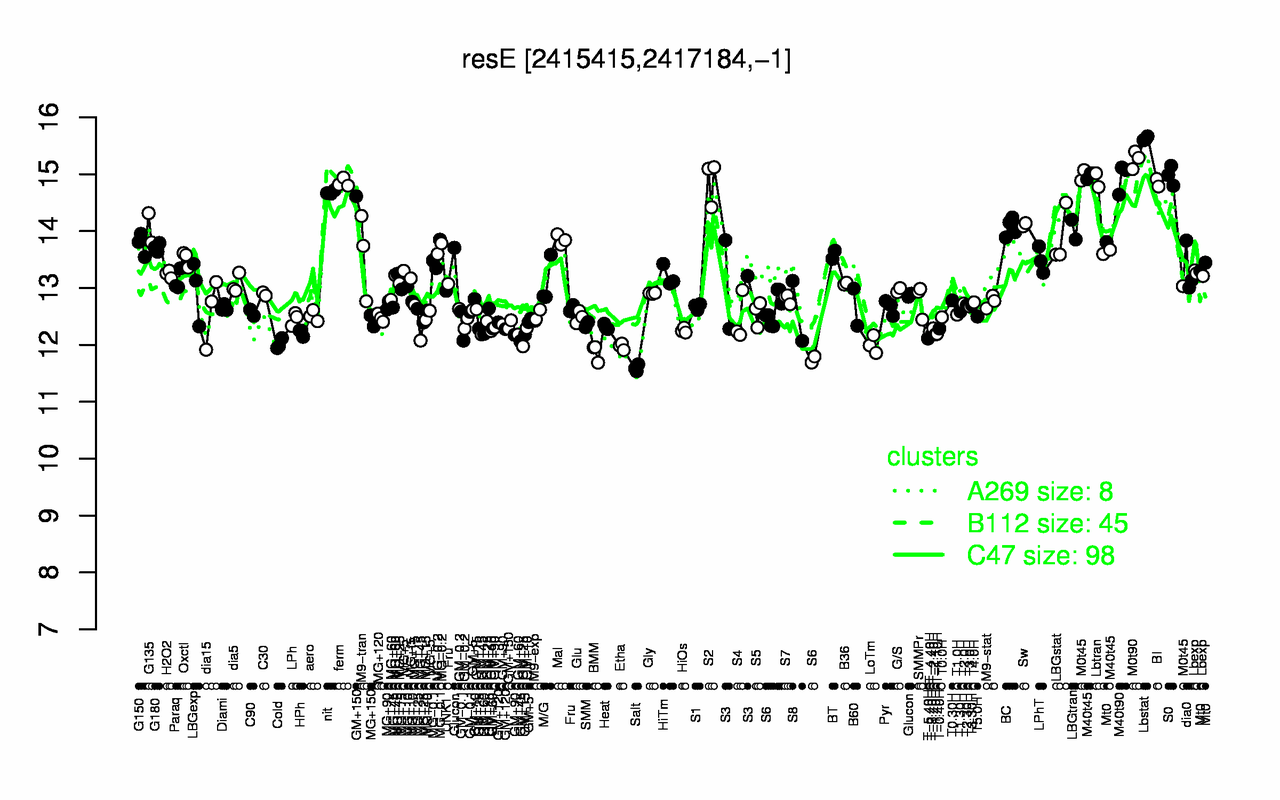
| Lbstat | M0t90 | S0 | M40t90 | S2 | ferm | BI | nit | M40t45 | Lbtran |
| 15.6 | 15.3 | 15 | 14.9 | 14.9 | 14.9 | 14.9 | 14.7 | 14.5 | 14.5 |
| Salt | BMM | Etha | LoTm | Cold | T-5.40H | GM+45 | T-3.40H | T-1.40H | T-1.10H |
| 11.6 | 11.9 | 12 | 12 | 12 | 12.1 | 12.2 | 12.2 | 12.2 | 12.2 |