| Start Page |
|
 |
| Start Page |
|
|
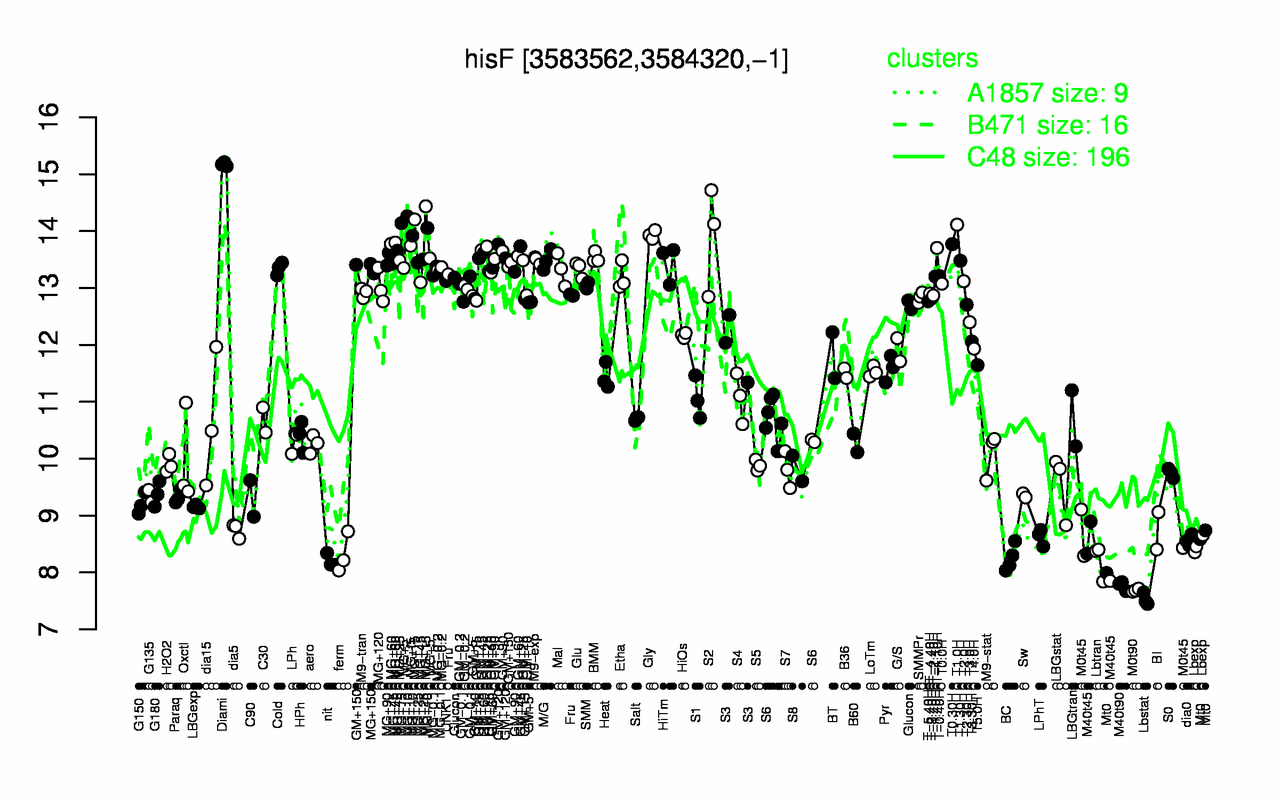
| Diami | MG+15 | T1.0H | MG+10 | Gly | S2 | MG+60 | T0.30H | MG+t5 | T-1.10H |
| 15.2 | 14.3 | 14.1 | 14.1 | 13.9 | 13.9 | 13.8 | 13.8 | 13.7 | 13.7 |
| Lbstat | M0t90 | M40t90 | nit | Lbtran | BC | ferm | M40t45 | Mt0 | Lbexp |
| 7.53 | 7.69 | 7.77 | 8.2 | 8.21 | 8.25 | 8.32 | 8.36 | 8.44 | 8.49 |