| Start Page |
|
 |
| Start Page |
|
|
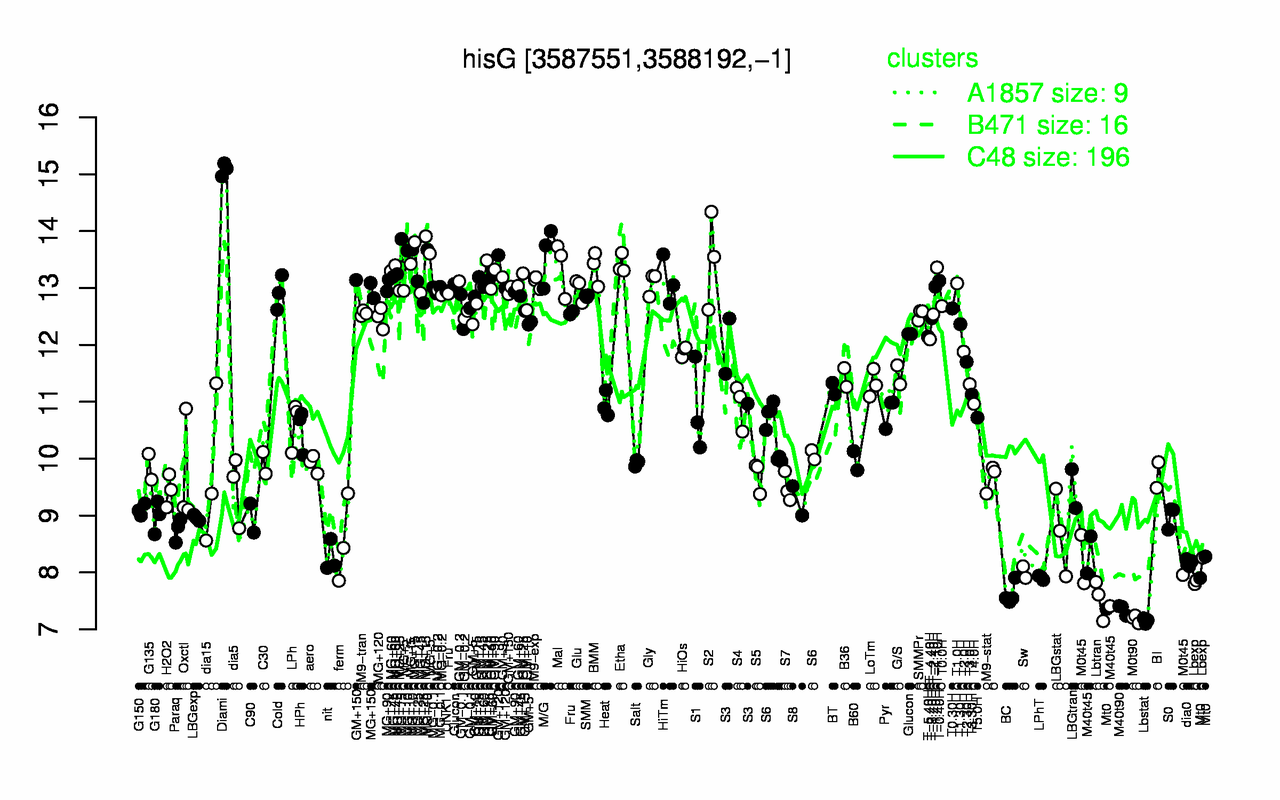
| Diami | MG+15 | MG+10 | M/G | S2 | MG+t5 | Etha | Mal | T-1.10H | BMM |
| 15.1 | 13.9 | 13.7 | 13.6 | 13.5 | 13.4 | 13.4 | 13.4 | 13.4 | 13.4 |
| Lbstat | M0t90 | M40t90 | Lbtran | BC | Mt0 | LPhT | Lbexp | Sw | M40t45 |
| 7.15 | 7.19 | 7.35 | 7.53 | 7.62 | 7.85 | 7.91 | 7.97 | 8.01 | 8.01 |