B. subtilis Expression Data Browser
Start Page
B. subtilis Expression Data Browser
Gene/Segment:
hisD
Locus Tag:
BSU34910
Details about hisD
Show/Hide
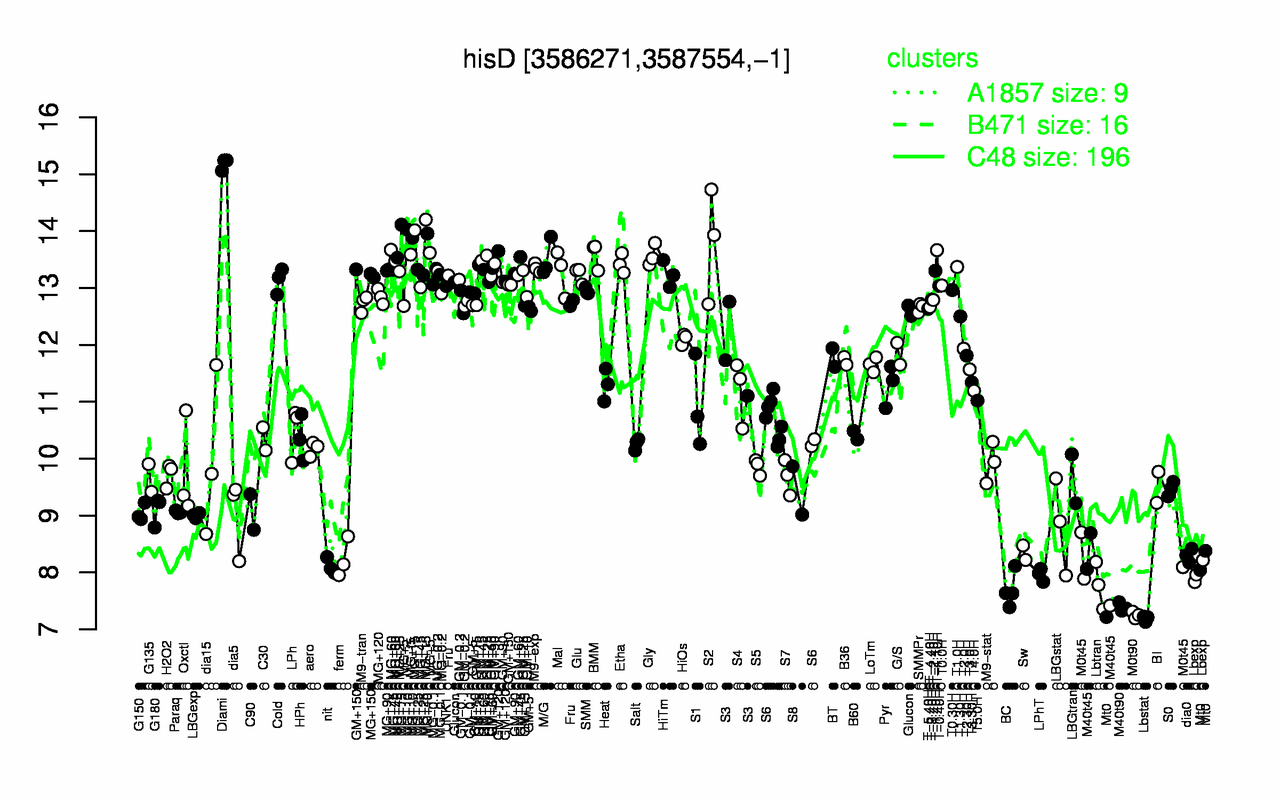
Highest Expression Conditions
Diami
MG+15
MG+10
S2
T-1.10H
MG+t5
BMM
Gly
MG+60
M/G
15.2
14.1
14
13.8
13.7
13.6
13.6
13.6
13.6
13.5
Lowest Expression Conditions
Lbstat
M0t90
M40t90
BC
Lbtran
Mt0
LPhT
Lbexp
M40t45
nit
7.19
7.25
7.39
7.69
7.77
7.88
7.96
8
8.06
8.11
Most Positively Correlated Segments
hisB
hisG
hisH
hisA
hisF
hisI
hisZ
S1332
yoaB
opuCB
1
1
0.99
0.99
0.99
0.99
0.98
0.95
0.77
0.77
Most Negatively Correlated Segments
S785
ydhE
uxaC
S1070
tdh
mntH
kbl
yvjA
yrzB
yvdS
-0.64
-0.64
-0.63
-0.63
-0.62
-0.62
-0.61
-0.6
-0.6
-0.6
Expression Profile of Segment hisD
Show/Hide
Annotation of Gene hisD
Show/Hide
function
16.2: Construct biomass (Anabolism)
inference
ab initio prediction:AMIGene:2.0
codon_start
1
EC_number
1.1.1.23
transl_table
11
note
Evidence 2a: Function of homologous gene experimentally demonstrated in an other organism; PubMedId: 10353847, 10353848; Product type e: enzyme
db_xref
GI:2636004
product
histidinol dehydrogenase
protein_id
CAB15496.1
Genomic View of Gene/Segment hisD
Show/Hide
(Legend)
Browse Genome Context